










/ kraahn-stuh-bl /
A cron replacement with retries, alerts, saved run history, and workflows, plus dashboards for the web, the terminal, and iOS. Built for efficiency and machines of all sorts and sizes.
cronstable runs your commands from a schedule file, following cron's model. It adds retries, alerting, durable state, orchestration, clustering, and a live dashboard.
- YAML and classic crontab files: define jobs in YAML or load an existing crontab (see classic crontab files)
- Business-day schedules: run on the last weekday of the month, the weekday nearest a date, or the nth occurrence of a weekday (see business-day schedules)
- Schedule linting: flag impossible schedules, uneven intervals, and daylight-saving surprises (see schedule introspection)
- Support for any time zone
- iCal calendar export: subscribe to upcoming runs in your calendar app or view them in the dashboard's week calendar (see calendar export)
- Result verification: check a job's output before recording success or starting downstream tasks (see result verification)
- Configurable failure conditions
- Automatic retries with exponential backoff
- Failure notifications through Sentry, email, and Slack-compatible webhooks
- End-to-end encrypted push notifications: send alerts to the iOS app that only paired devices can decrypt (see push notifications)
- Per-job SLA monitoring: detect missing or late runs and excessive runtimes, with alerts and dashboard status (see late-run detection)
- Shared resource pools: limit capacity across jobs and workflow tasks, with priority queues and deadlines (see resource pools)
- Selective workflow recovery: retry failed tasks or replay failed dates while reusing successful results (see workflow recovery)
- Opt-in durable state: preserve history and retries across restarts, catch up missed runs, and share state between jobs (see durable state)
- Durable workflows: coordinate tasks with dependencies, data sharing, dynamic fan-out, sensors, and approval gates (see workflow orchestration)
- Web, terminal, and iOS dashboards: follow live logs, review history, control jobs and workflows, and monitor the cluster
- Optional HTTP REST API for job status, history, and control
- Runtime pause/resume: pause scheduled runs for maintenance without editing configuration (see pausing jobs)
- Built-in TLS: serve the API over HTTPS, optionally require client certificates, and reload web certificates without restarting (see serving the API over TLS)
- MCP server: let AI agents inspect jobs and debug schedules (read-only by default, with optional control)
- Prometheus and statsd metrics: track outcomes, durations, retries, and cluster health (see metrics)
- Per-job resource monitoring: track CPU time and peak memory across each job's process tree (see resource monitoring)
- Job-set ID: compare configuration fingerprints to detect drift between replicas (see job-set ID)
- Opt-in clustering and leader election: coordinate job execution across replicas (see clustering and leader election for backend options and guarantees)
- Built for restricted containers: run as a non-root user with a read-only root filesystem and restricted Kubernetes security settings (see production container deployment)
- Prebuilt releases: multi-architecture container images and self-contained binaries for Linux, macOS, BSD, illumos, and Windows (see installation)

Web UI tour.
To run your first scheduled job with a live dashboard, install cronstable. For Docker, Homebrew, and standalone binaries, see installation.
pip install cronstableCreate a cronstable.yaml file with your first job:
jobs:
  - name: hello
    command: echo "hello from cronstable on $(hostname)"
    schedule: "* * * * *"        # every minute
    captureStdout: true

web:
  listen:
    - http://127.0.0.1:8080      # optional: the REST API + dashboard
Start the scheduler. It runs in the foreground:
cronstable -c cronstable.yamlOpen http://127.0.0.1:8080/ to view the job's live output in the
dashboard. The hello job runs once a minute.
Schedules use UTC by default. To use a different time zone, set timezone
on the job (see time zones).
You can extend this configuration to:
- Get failure alerts: retries with backoff, and a Slack, email, or Sentry report when a job still fails after its retries (tutorial).
- Survive restarts: a
state:block preserves history and retries, and catches up missed runs (tutorial). - Chain jobs into a pipeline: a durable workflow with data sharing and an approval gate (tutorial).
- Coordinate replicas: use leader election to assign scheduled jobs to a leader (tutorial).
- Watch from your phone: pair the iOS app from the dashboard to get the jobs board, live logs, and encrypted alerts on iPhone and iPad.
- See it all at once:
docker compose -f example/grand-tour/docker-compose.yml up --buildstarts a nine-node cluster that uses every feature (example gallery).
To use an existing crontab exported with crontab -l, run
cronstable -c my.crontab. For a system crontab such as /etc/crontab,
convert its entries to YAML to preserve per-job users. See
classic crontab files for format differences.
Every release publishes prebuilt multi-architecture images for seven Linux
platforms to two registries: the GitHub Container Registry
(ghcr.io/ptweezy/cronstable) and Docker Hub (ptweezy/cronstable). Mount
your configuration file and start the container:
docker run --rm \
  -v "$PWD/cronstable.yaml:/etc/cronstable.d/cronstable.yaml:ro" \
  ghcr.io/ptweezy/cronstable:latest
The default image is built on Debian slim, runs as a non-root user, and reads
its configuration from /etc/cronstable.d. Each release also publishes Alpine,
Ubuntu, RHEL/UBI, Fedora, openSUSE, Amazon Linux, and distroless variants,
tagged with a -<distro> suffix. For the platform list, the variant table, and
each variant's architecture coverage, see
installation in the
wiki. In production, pin a specific version instead of latest, and see
production container deployment for the
hardened Kubernetes and Docker setup.
cronstable requires Python 3.10 or later. On a system with an older Python, use the binary instead. Install cronstable in a virtual environment:
pip install cronstableOr let pipx create an isolated environment for you:
pipx install cronstableBoth package managers install the self-contained release binary for your platform, so you don't need Python.
macOS or Linux:
brew install ptweezy/tap/cronstableWindows:
winget install ptweezy.cronstableUpgrade later with brew upgrade cronstable or
winget upgrade ptweezy.cronstable.
winget installs a signed, per-machine MSI. Approve the administrator prompt,
and then open a new shell so that cronstable is on your PATH. The installer
registers the Windows service without starting it. It also creates the
configuration directory, which only SYSTEM and Administrators can write. The
service starts at the next boot and runs no jobs until you add configuration.
For package availability and how to switch from a portable install, see the
WinGet installation guide.
You can also download a self-contained binary from the releases page. Every release attaches these builds:
- Linux: glibc and musl builds for
amd64,amd64v3,arm64,i686,armv7,armv6,ppc64le,s390x,riscv64, andloong64, plus glibc-only builds formips64leandarmel - macOS:
amd64,amd64v3, andarm64, signed and notarized by Apple - FreeBSD:
amd64,amd64v3, andarm64 - OpenBSD and NetBSD
- illumos:
amd64andamd64v3 - Windows:
amd64,amd64v3,arm64, andi686 - Packages:
.deb,.rpm, Alpine.apk, and FreeBSD.pkg
The amd64, amd64v3, arm64, and s390x glibc builds need only glibc 2.17,
so they run on RHEL 7 and later. The ppc64le build needs glibc 2.28 (RHEL 8
and later). Python is embedded in the executable, so the target system doesn't
need it.
For x64 downloads, choose one of these builds:
amd64v3(recommended for compatible CPUs): uses an optimized embedded Python runtime and requires the full x86-64-v3 feature set.amd64(compatibility build): choose this build when the CPU or VM doesn't support x86-64-v3, or when you're unsure.
Every amd64 binary and package format has a v3 counterpart. All eight Docker
image variants also have -amd64v3 tags, such as latest-amd64v3 and
latest-alpine-amd64v3; use them on compatible hosts. The amd64 assets and
Docker tags target baseline x86-64 CPUs, and Homebrew, Scoop, and winget
install the baseline downloads. For details, see
CPU requirements and variant selection.
# Recommended for an x86-64-v3-capable Linux CPU (glibc).
# Use amd64 instead of amd64v3 for compatibility; append -musl on Alpine.
curl -fsSL -o cronstable \
  https://github.com/ptweezy/cronstable/releases/latest/download/cronstable-linux-amd64v3
chmod +x cronstable
./cronstable --version
At startup, the binary unpacks its embedded Python runtime, so on a read-only
root filesystem it needs a small temporary mount that is writable and
executable. The container image and pip or pipx installs don't self-extract.
For the full asset table, glibc and musl compatibility notes, and a tmpfs or
emptyDir recipe, see
installation in the
wiki.
Windows releases also attach two more formats:
cronstable-windows-<arch>.zip: a one-directory build that extracts to a singlecronstablefolder and can host the Windows service.cronstable-windows-<arch>.msi: a machine-wide installer that registers the service, for deployment through Group Policy, Intune, or SCCM. See the Windows MSI wiki page.
cronstable runs natively on Windows (x64, ARM64, and 32-bit x86). Install it
with pip install cronstable, or use one of these builds from the
releases page, none of which
need Python:
cronstable-windows-amd64v3.exe: the self-contained build, recommended for compatible x64 CPUscronstable-windows-amd64.exe: the self-contained compatibility buildcronstable-windows-arm64.exeandcronstable-windows-i686.exe: the self-contained builds for ARM64 and 32-bit x86cronstable-windows-<arch>.zip: the one-directory build, which can host the Windows servicecronstable-windows-<arch>.msi: the machine-wide installer
The YAML crontab, scheduling, reporting, retries, the HTTP API, and the web dashboard work the same as on POSIX systems. These platform details differ:
-
Default config location. If you don't pass
-c, cronstable uses the machine-wide%ProgramData%\cronstabledirectory (the Windows equivalent of/etc/cronstable.d) when it contains configuration. Otherwise, it uses the per-user%APPDATA%\cronstabledirectory, for exampleC:\Users\you\AppData\Roaming\cronstable.cronstable initwrites a commented starter configuration to whichever directory applies. To use any other path, pass-c:cronstable -c C:\path\to\cronstable.yaml
-
Default shell. A string
commandwithout an explicitshellruns through the native command processor (%ComSpec%, which iscmd.exe). It plays the role that/bin/shplays on POSIX. You can setshell: cmdorshell: powershelldirectly: cronstable passescmd.exethe/cflag and the quoting it expects, and passes-cto every other shell. For PowerShell or any other interpreter, setshell:, or passcommandas a list to bypass the shell entirely:jobs: - name: powershell-job command: - powershell - -Command - Get-Date schedule: "*/5 * * * *" captureStdout: true
-
Graceful shutdown. Press
Ctrl-Cto stop cronstable. It shuts down once the running jobs finish, the same asSIGTERMon POSIX. Each job runs in its own console process group, so the keystroke never reaches the jobs themselves. Closing the console window or shutting down the machine also lets running jobs finish, within the few seconds that Windows allows.To stop a daemon that has no console, call the authenticated
POST /shutdownroute. It also stops the Windows service cleanly, without triggering the service's recovery actions. Signing out doesn't stop the daemon, because an unattended daemon receives the sign-out event for every user on the machine. -
Running unattended as a Windows service.
cronstable service install -c C:\ProgramData\cronstableregisters the scheduler with the Service Control Manager (SCM). The service starts at boot, runs whether or not anyone is signed in, appears inservices.msc, and uses the Windows recovery actions. When you stop the service, it lets running jobs finish first, and it reports the stop as in progress to the SCM until they do.cronstable service reloadrereads the configuration immediately, likeSIGHUPon POSIX. The service support is a ctypes shim over advapi32, so it adds no dependencies.The published one-file
.execan't host a service, because its bootloader runs the program in a child process that the SCM never sees; theinstallcommand reports this. To run as a service, install with pip or pipx, use the one-directory.zipbuild, or use theschtasksrecipe. For details, see Windows Service and Running on Windows. -
Migrating from Task Scheduler.
cronstable import-taskscheduler tasks.xml -o jobs.yamlconverts exported Task Scheduler tasks into cronstable jobs. It maps time, calendar, and boot triggers;Execactions; working directories; execution time limits; instance policy; and priority. It's a one-time converter rather than a loader, because exporting a task doesn't unregister it. It lists everything it can't convert, with the reason, instead of dropping it. On a whole-machine export, that list is long, because most tasks on a stock Windows installation are COM handlers or event-driven internals rather than schedules. For details, see Importing from Task Scheduler. -
Not supported on Windows. Windows has no
setuidorsetgidequivalent, so cronstable rejects per-jobuserandgroupsettings with a configuration error. It also skipsunix://web listeners with a warning; use anhttp://listener instead.
In its default stateless configuration, the cronstable container needs no
writable filesystem paths. The daemon reads its configuration and secrets
and writes its output to stdout and stderr. It can run as a non-root user with
the RuntimeDefault seccomp profile, a read-only root filesystem, all Linux
capabilities dropped, and configuration and secret volumes mounted with an
fsGroup.
Mount writable storage for the optional features you enable:
- Durable state needs a writable directory at
state.pathfor history, retries, workflows, and any archived output. - Filesystem clustering needs a writable shared directory at
cluster.filesystem.paththat supports locks across hosts. - Push device pairing needs a writable directory containing
push.devicesFile, or a writable state store whendevicesFileis omitted. - A
unix://web listener needs a writable directory for its socket. - The standalone binary needs a writable, executable temporary directory (see install using binary). The container images and pip installations don't self-extract.
Job commands and custom file logging can also need writable paths or additional permissions. Per-job user and group switching requires root.
The published images (ghcr.io/ptweezy/cronstable and
docker.io/ptweezy/cronstable) run as non-root and use
cronstable -c /etc/cronstable.d as the entrypoint. Mount your configuration
read-only and provide writable mounts for the features and jobs that need
them. For deployment examples, see
Production deployment
in the wiki. It covers a Kubernetes Deployment with a restricted security
context, baking configuration into your own image, and health checks.
The daemon serves the built-in web dashboard as a self-contained page, with no build step or external assets. To open it, enable the HTTP interface, and then open its address in a browser.
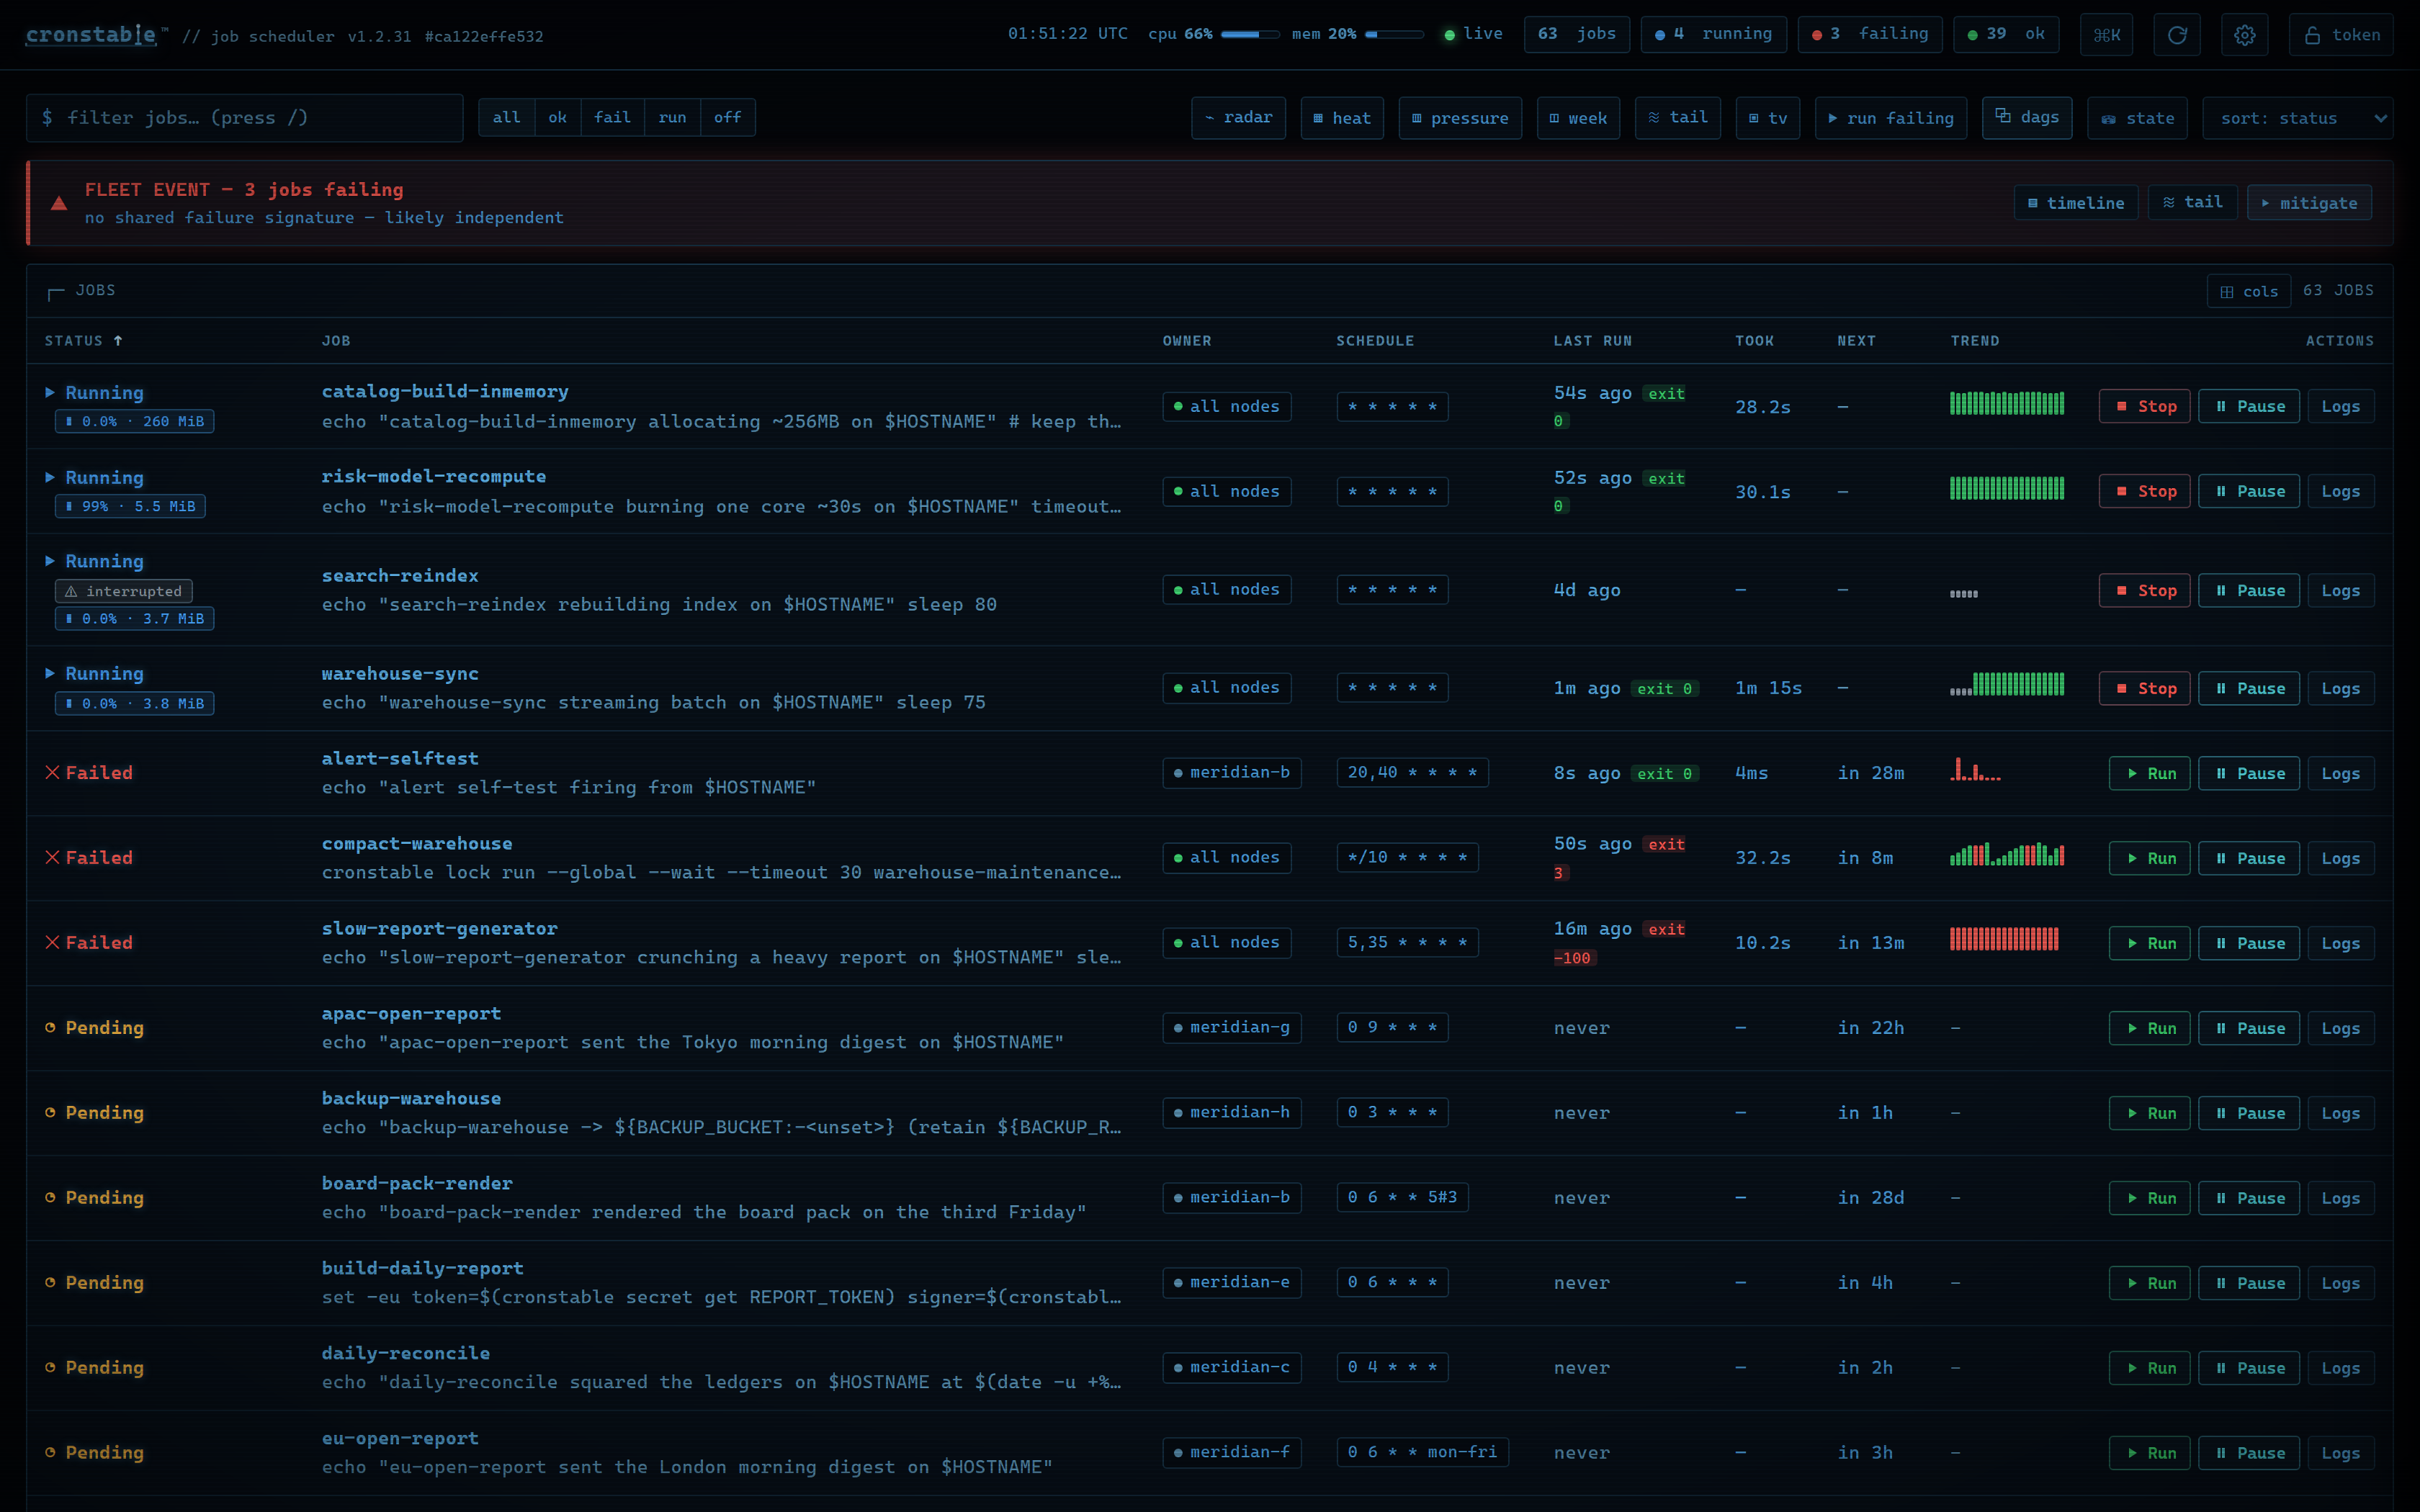
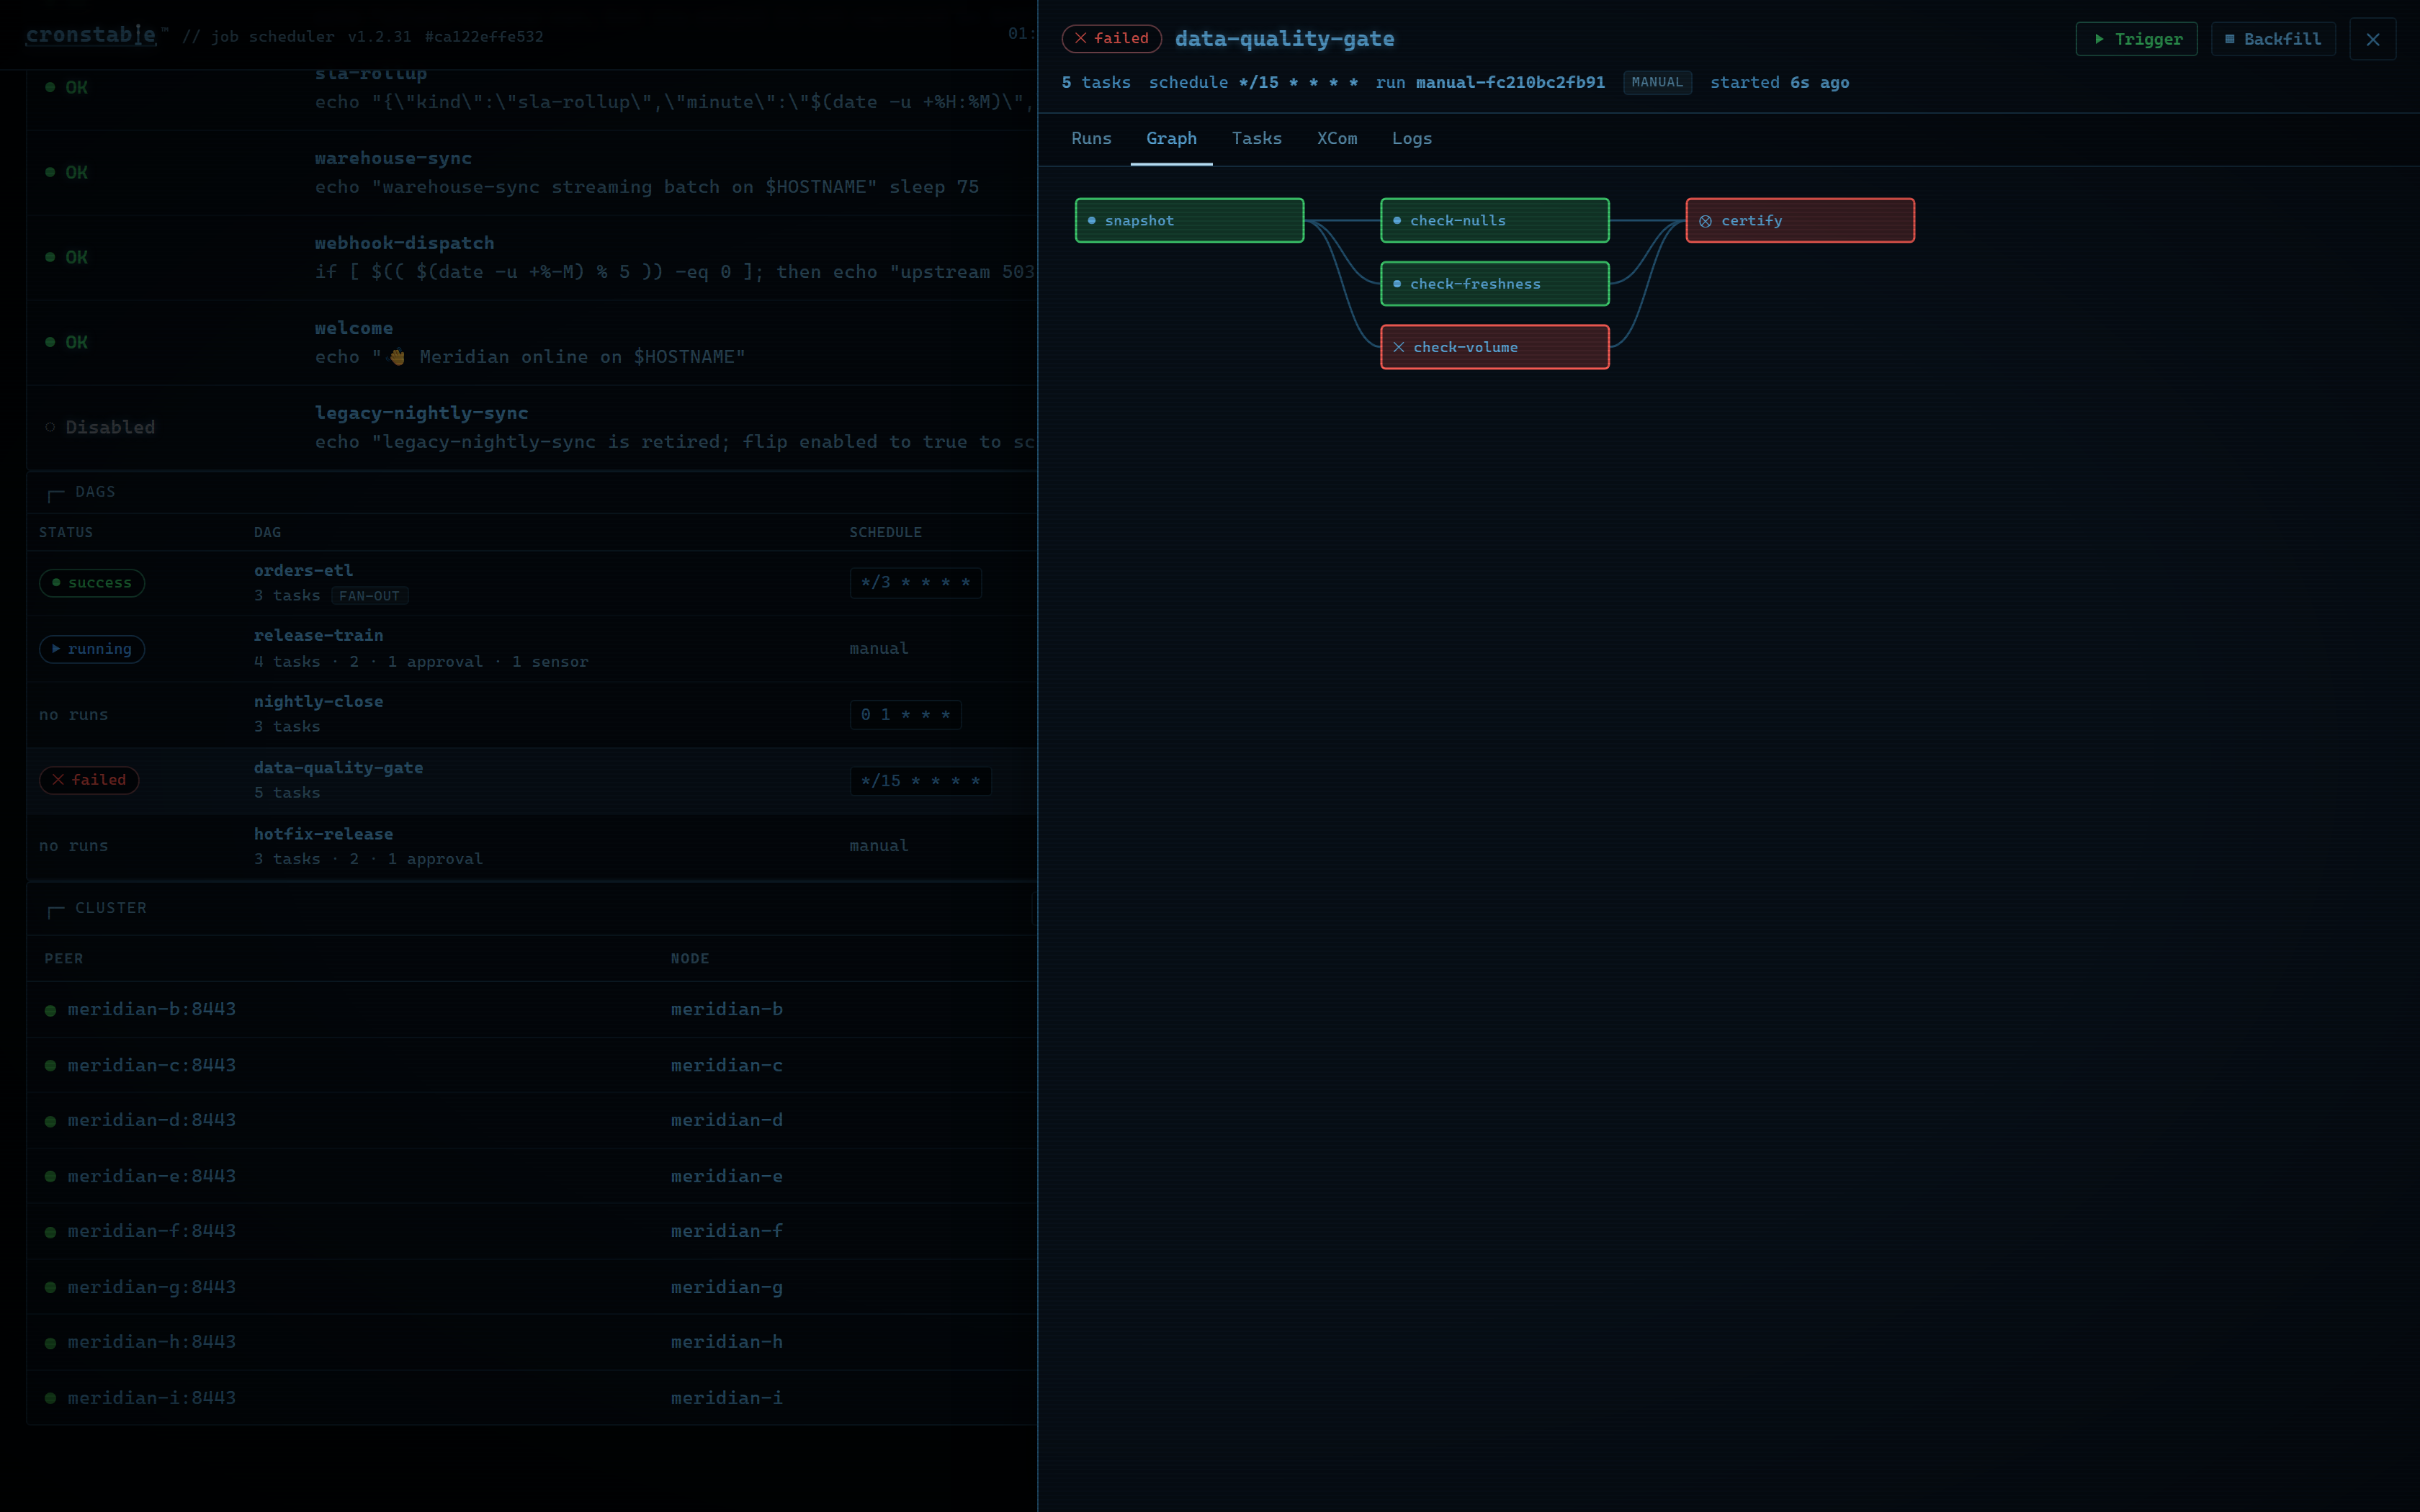
The overview shows job status, upcoming runs, recent outcomes, and resource usage when monitoring is enabled. Open a job to follow its logs, review run history, or inspect its schedule. You can also:
- Trigger workflows, follow task graphs, and approve or reject approval gates.
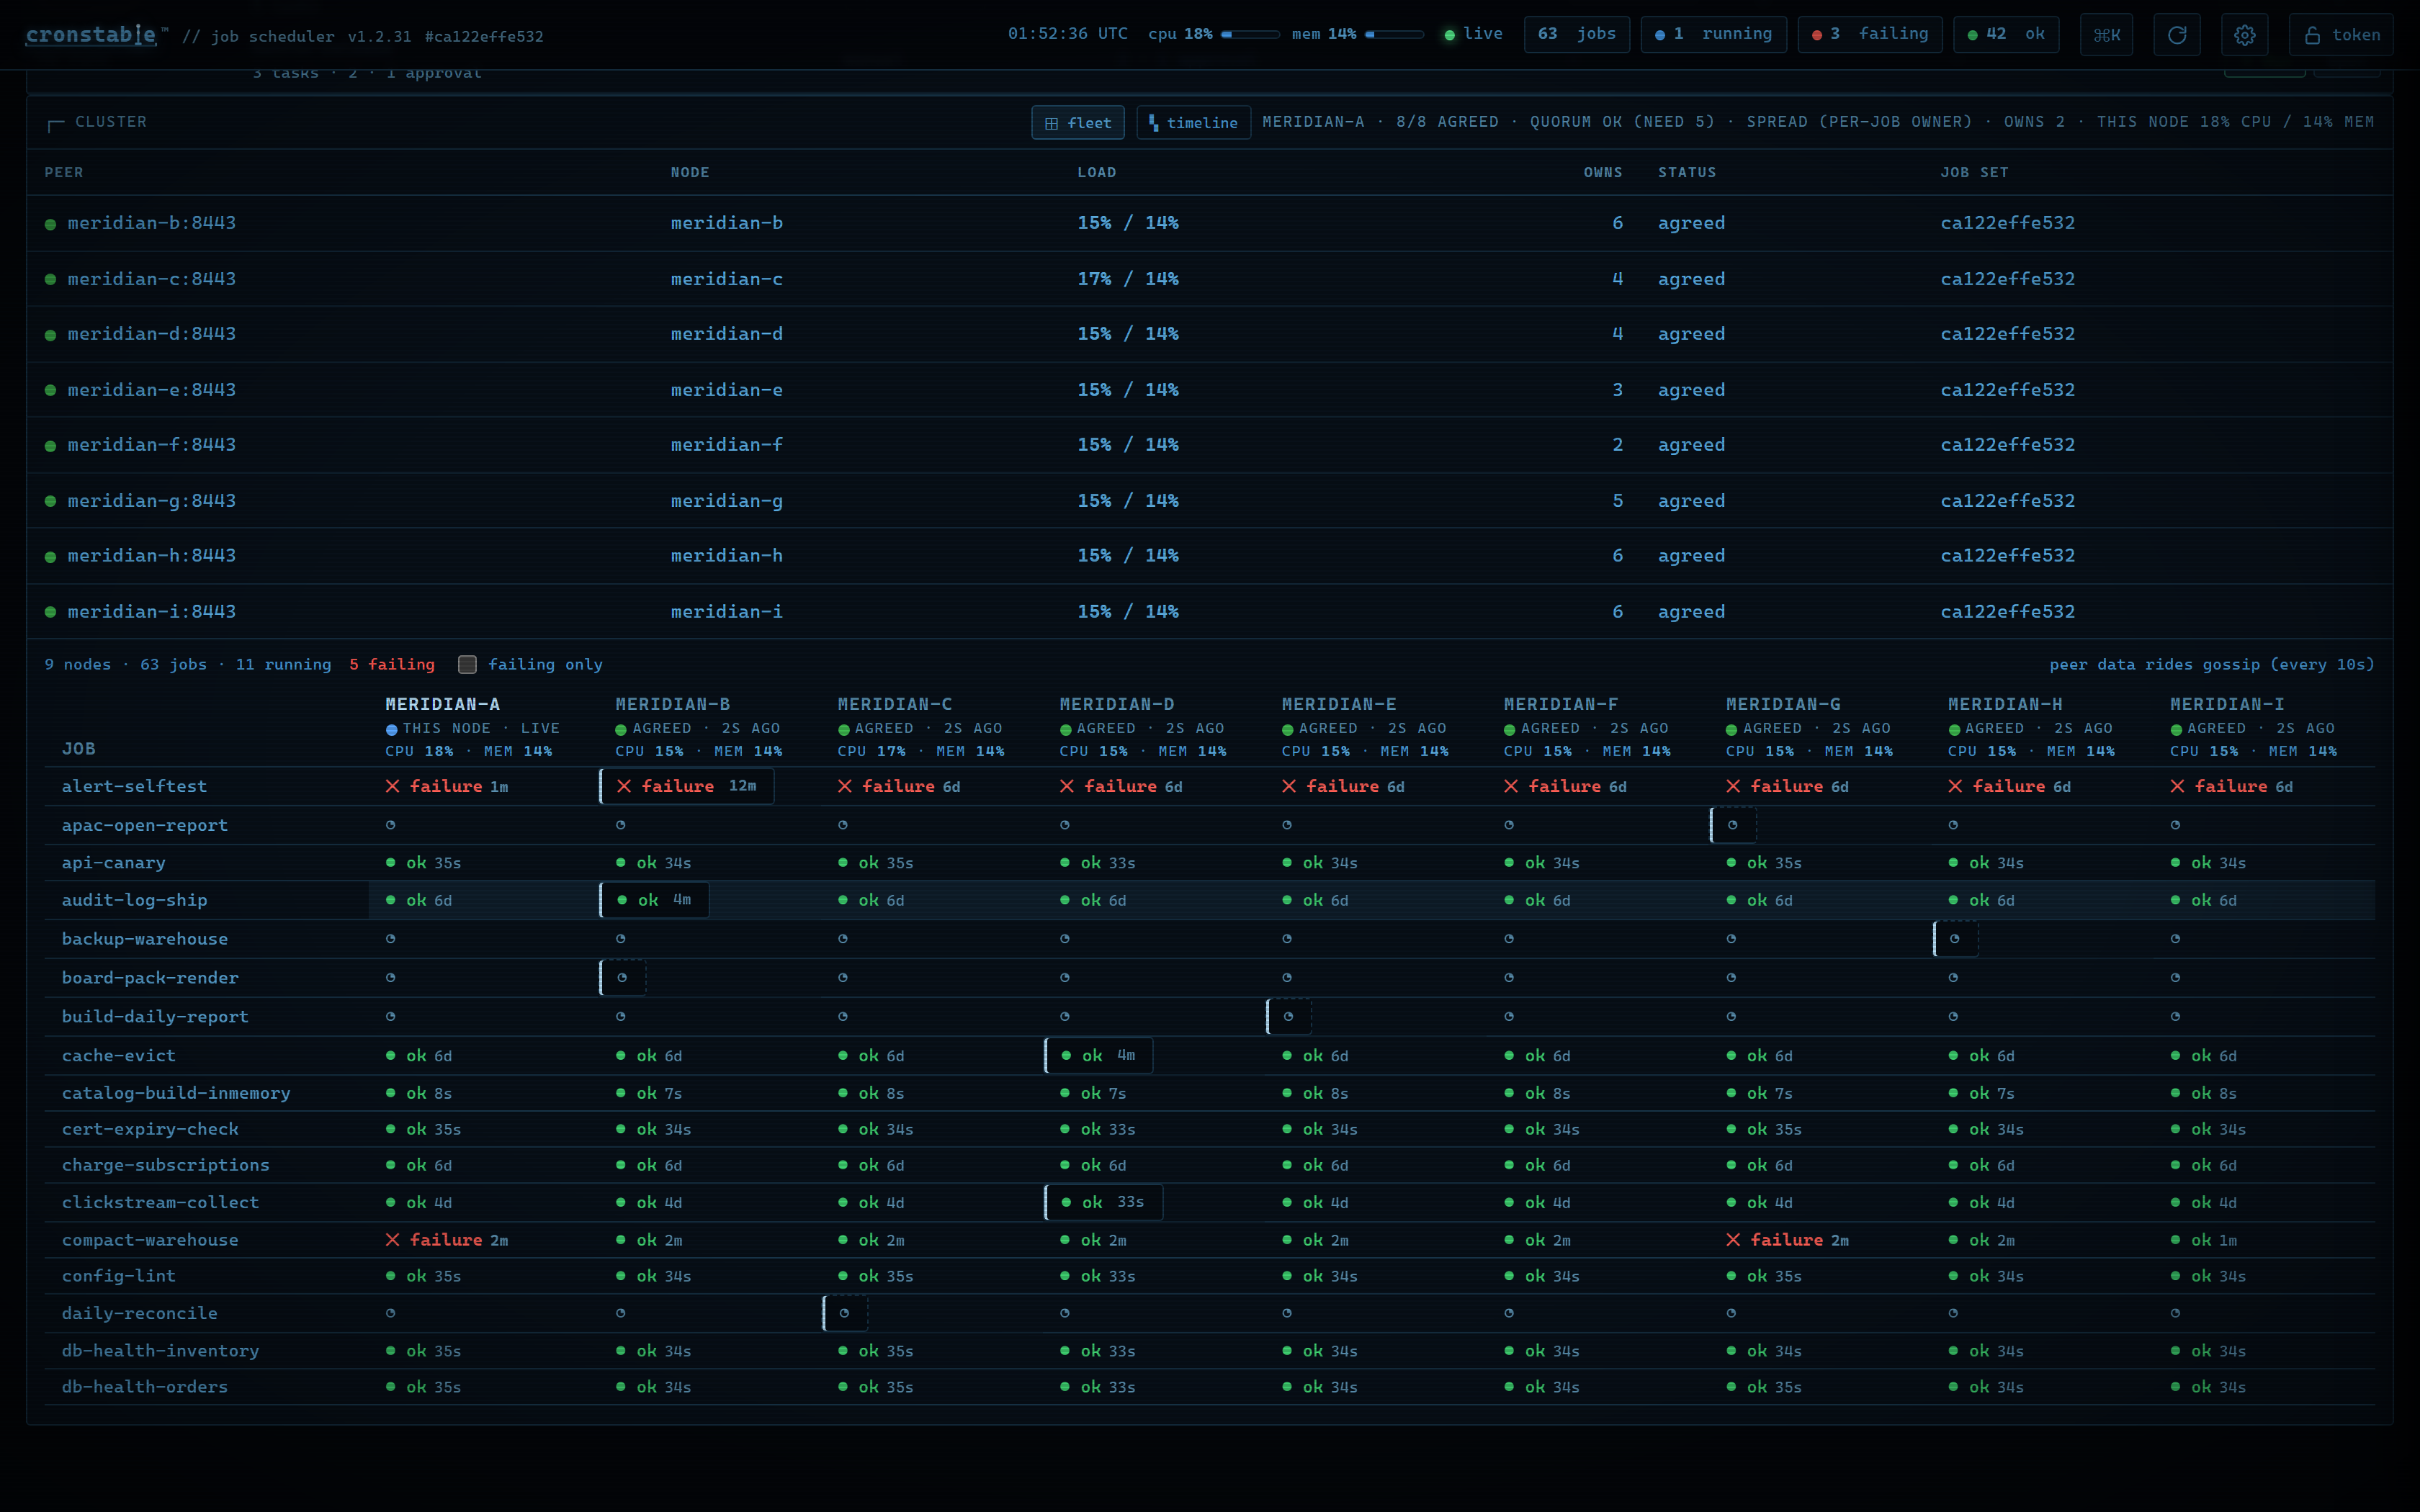
- Inspect cluster health and compare each job's runs across nodes.
- Investigate failures with an incident timeline and merged live logs.
- Use the wallboard, activity heatmap, and durable state inspector.
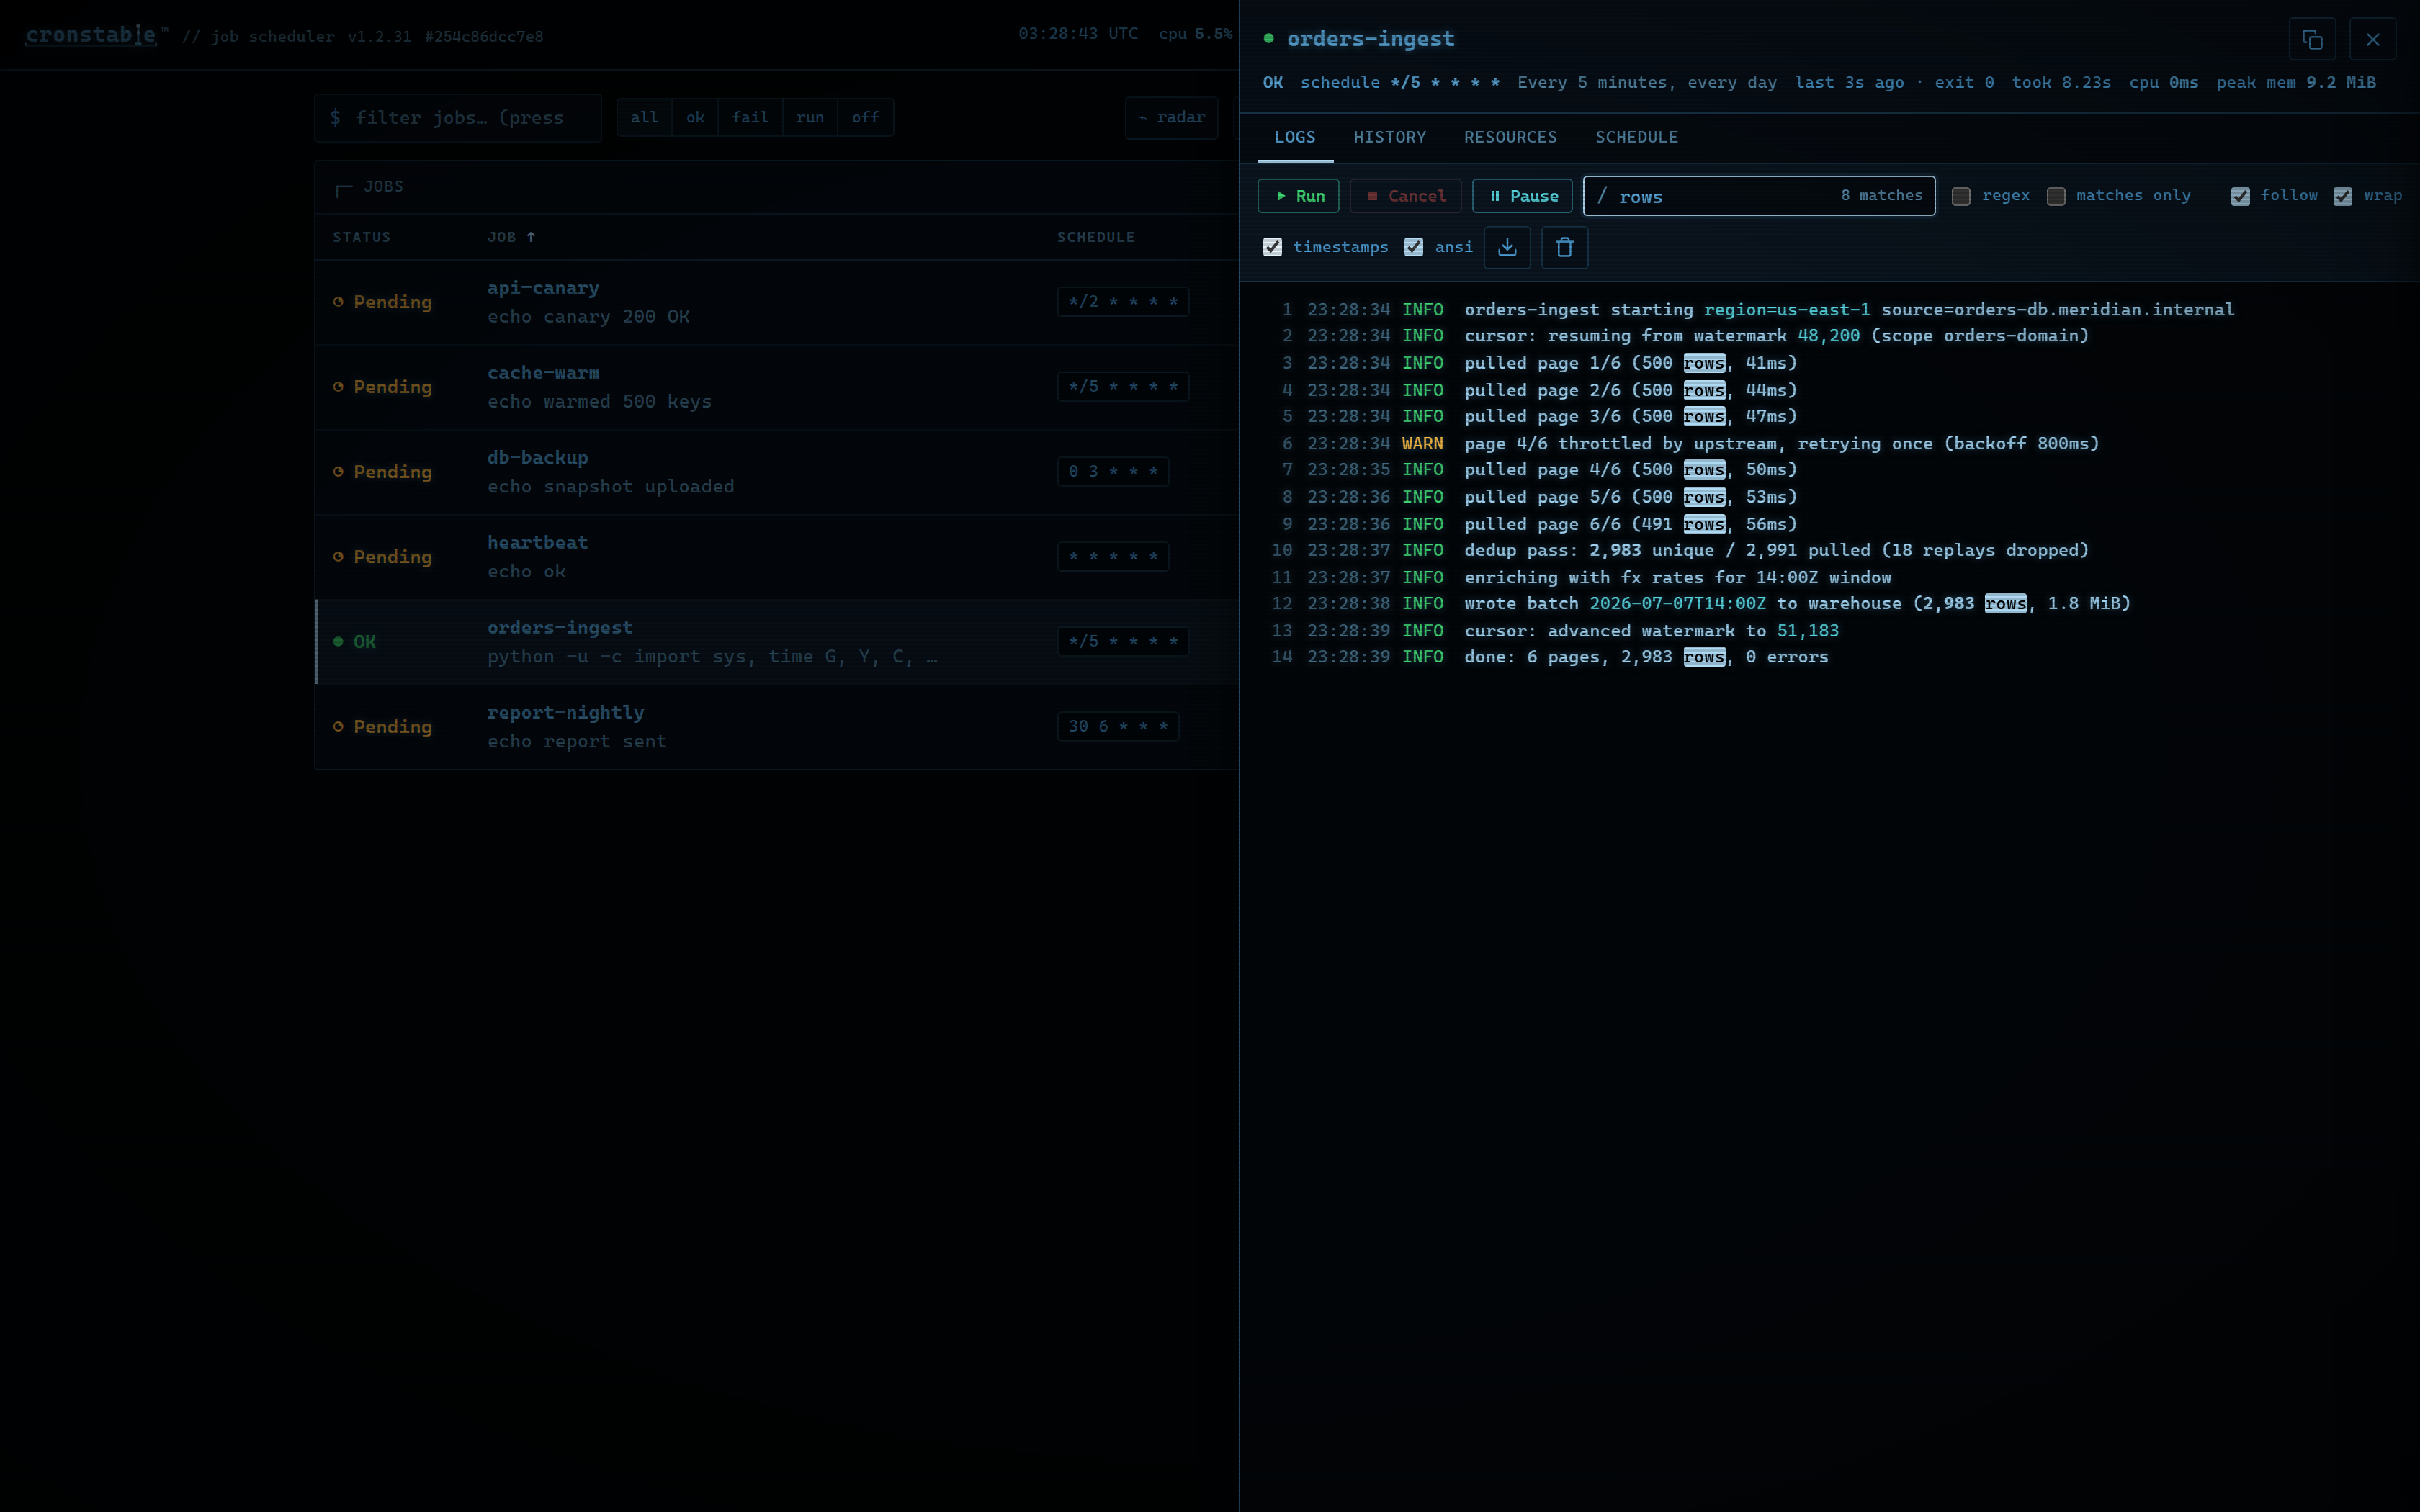
| Live logs | Workflow task graph | Fleet view |
|---|---|---|
 |
 |
 |
Press Ctrl-K or ⌘K for the command palette, ? for shortcuts, or Enter
to open the selected job. For readability, the dashboard has ten themes,
adjustable fonts and UI scale, color-vision-safe palettes, and reduced-motion
support. It shows status with text and symbols in addition to color.
Run history and captured output stay in memory by default. Enable the
durable state store
to preserve run history across restarts. To also save captured output when a
run finishes, set archiveOutput: true on the job or under defaults:.
The daemon serves the page with a strict Content Security Policy. For the full
panel tour, screenshots, shortcuts, and settings, see the
web dashboard guide.
To try the dashboard, start a demo node:
docker compose -f example/zen-demo/docker-compose.yml upThe example gallery includes a three-node cluster and the nine-node grand tour, with workflows, shared state, and failure reporters.
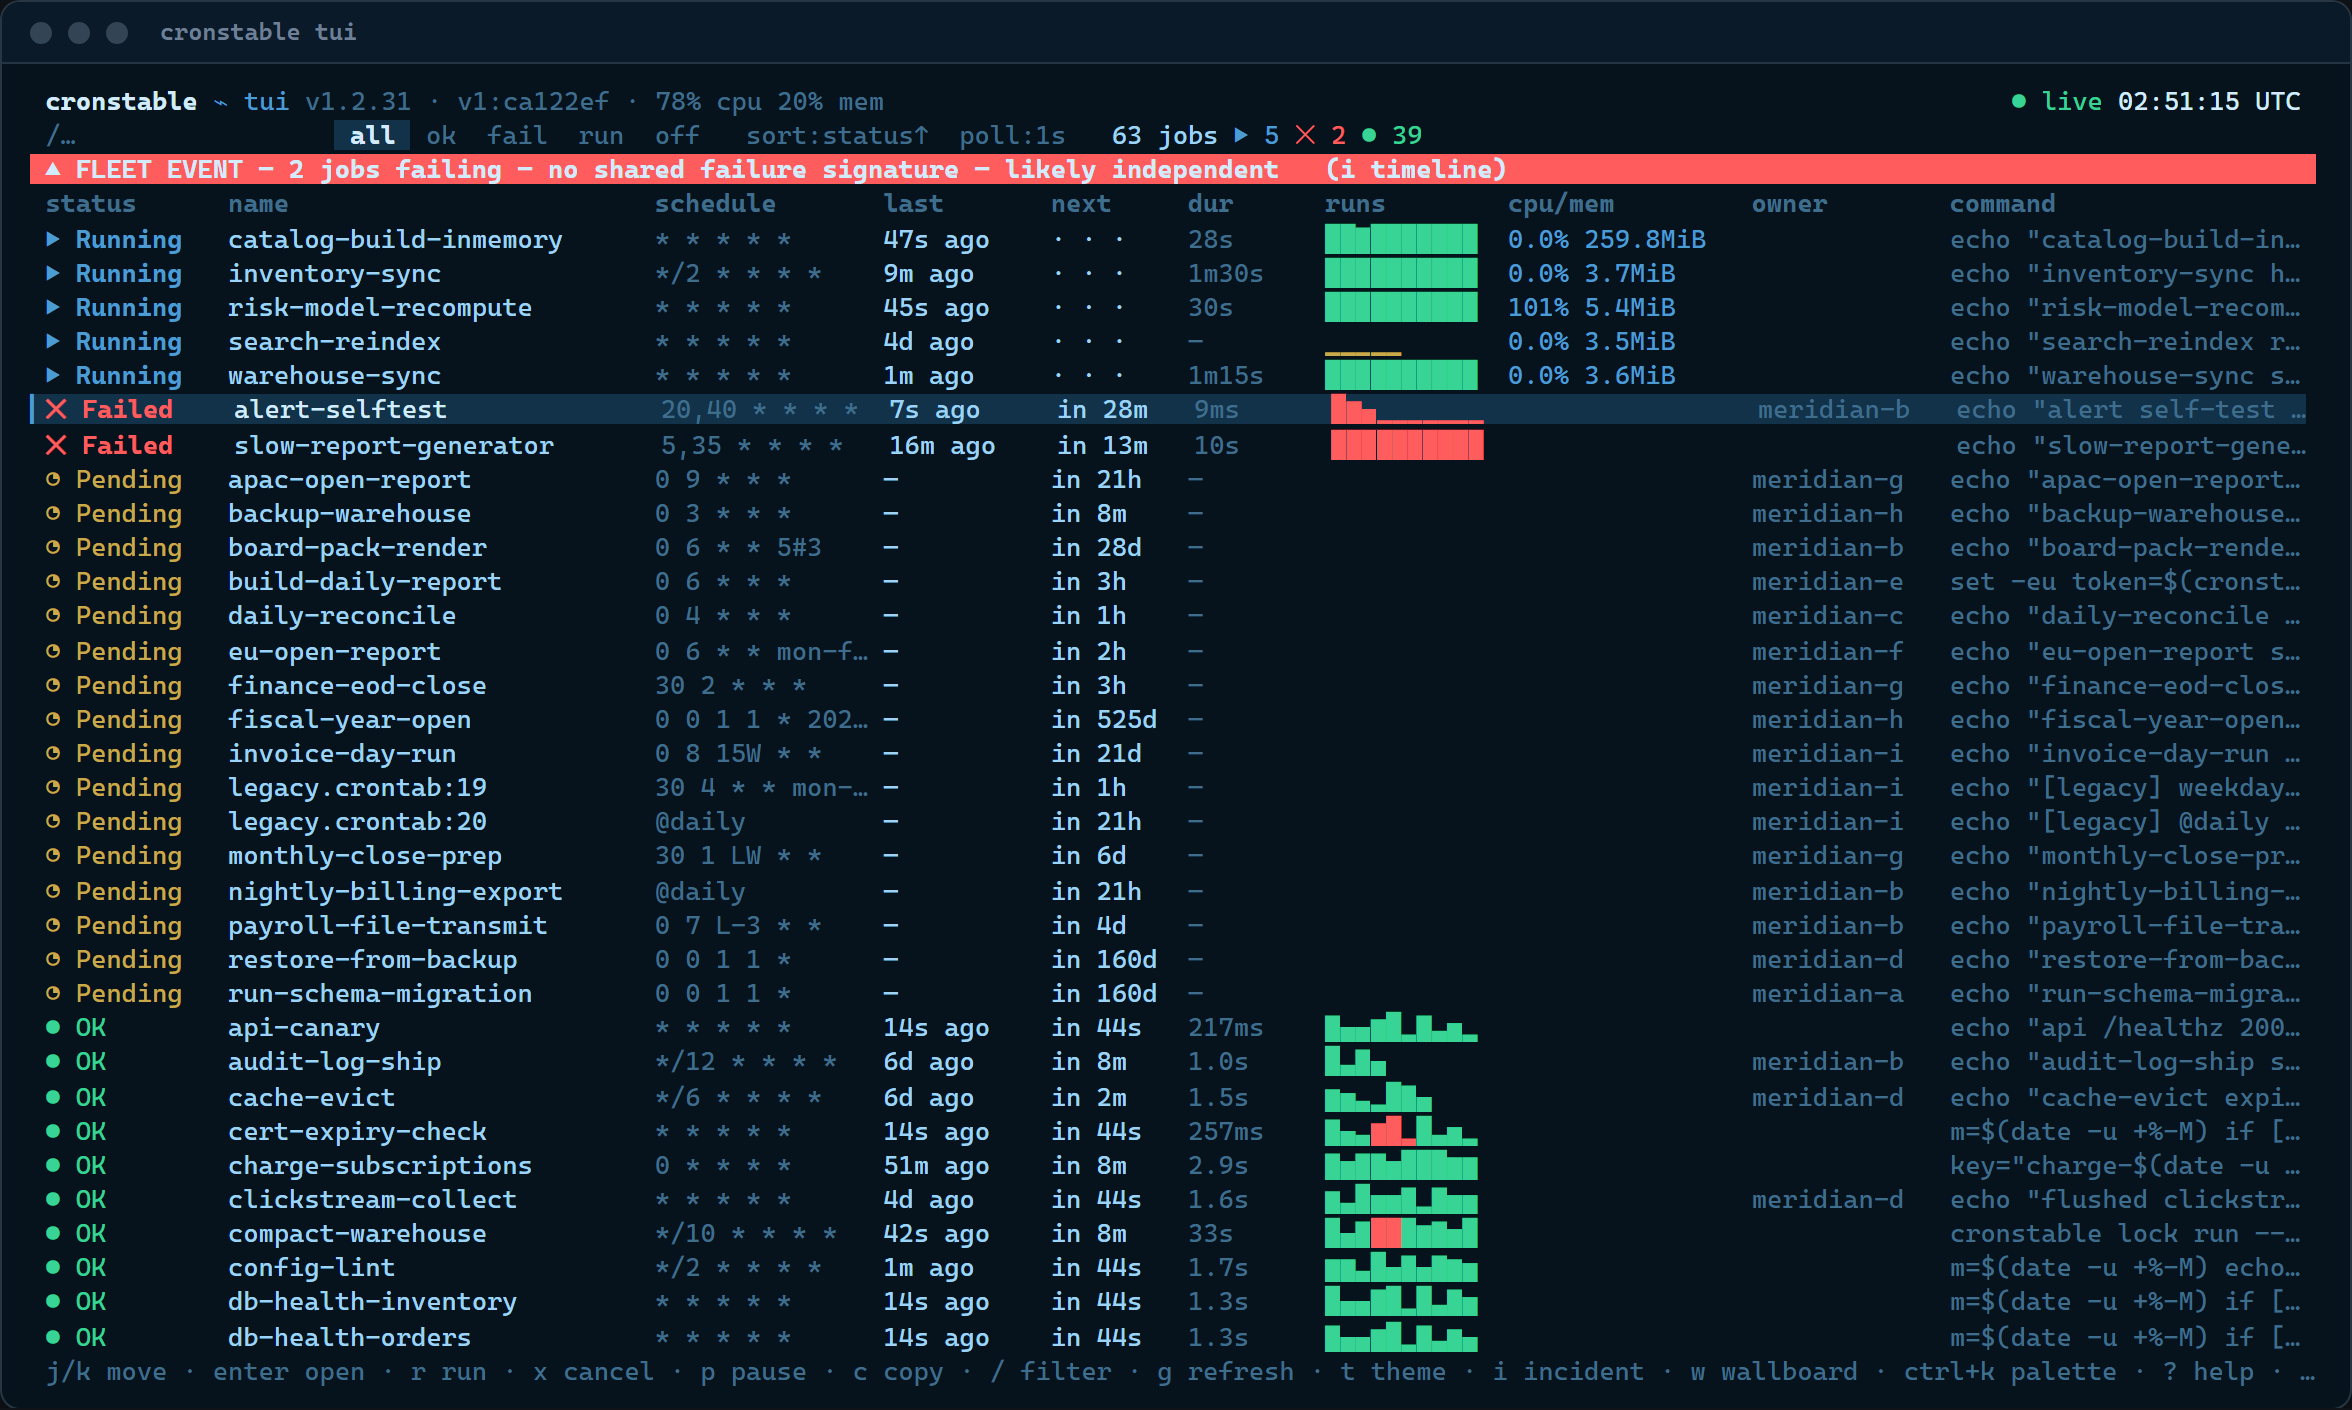
The cronstable tui command brings the dashboard to your terminal, including
over SSH and in tmux sessions. It uses the same HTTP API and keyboard shortcuts
as the web dashboard, and it has job logs, history, workflows, cluster views,
and incident tools.
cronstable tui                            # local daemon on port 8080
cronstable tui --url http://prod-node:8080  # remote daemon
cronstable tui --tv                       # open the wallboard
Use --token-env for authentication, --job to open a specific job, or
--ascii when your terminal lacks the status glyphs. For all options,
shortcuts, panels, themes, and screenshots, see the
terminal dashboard guide.
Cronstable for iPhone and iPad
The on-call companion and native dashboard for your cronstable servers.
The app is a full native dashboard, and it receives encrypted push alerts. It connects directly to your servers over the LAN, Tailscale, or HTTPS. It doesn't need an account or a sign-up, has no analytics or ads, and keeps access tokens in the device Keychain.
The app includes these features:
- Alerts for failed runs, SLA breaches, workflow failures, and approval gates. Each alert is sealed to the device's key before it leaves your server, and you can approve or reject a gate from the lock screen.
- The jobs board, run history, live log tails, workflow runs, run trends, CPU and memory charts, and node and cluster views.
- Schedule tools: pressure heatmaps, duplicate detection, a cron expression sandbox, and an answer to "why did this run?"
- Home Screen widgets for fleet health, and your job schedule as a calendar subscription.
Push notifications are optional. Without the push reporter, the app polls
your servers directly, every 1 to 300 seconds.
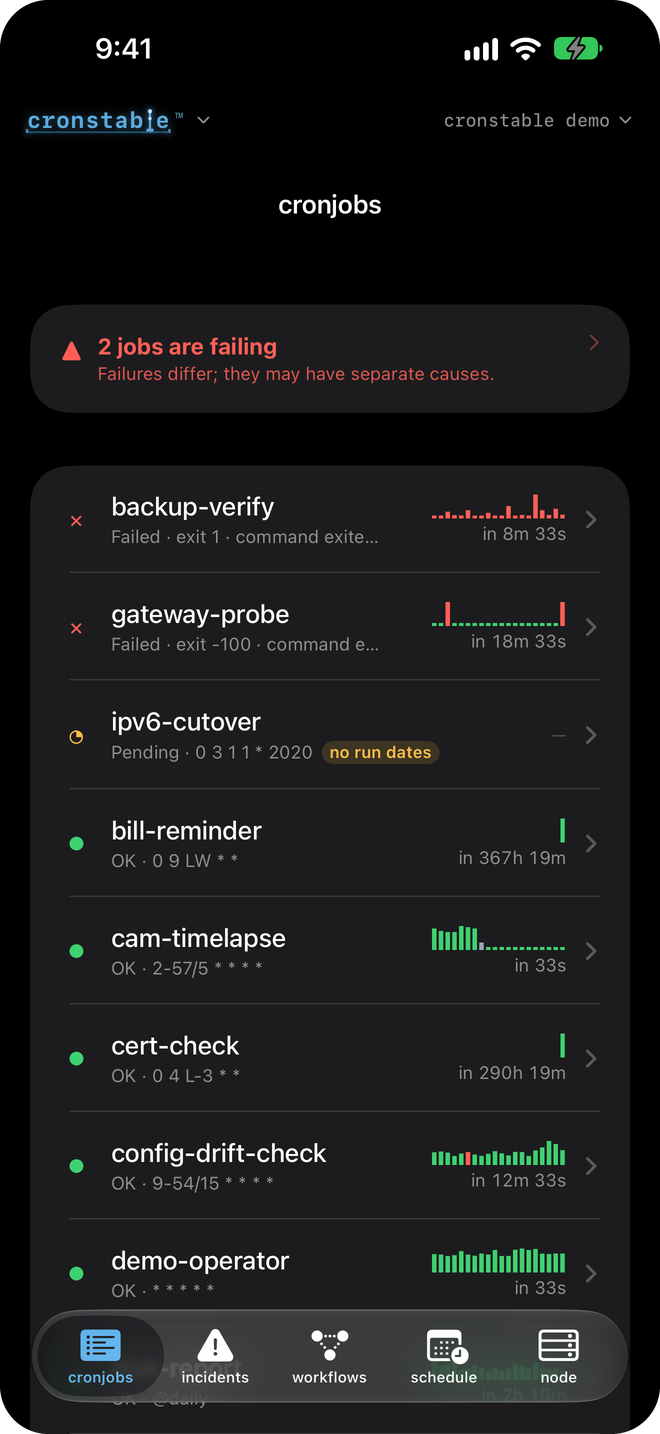
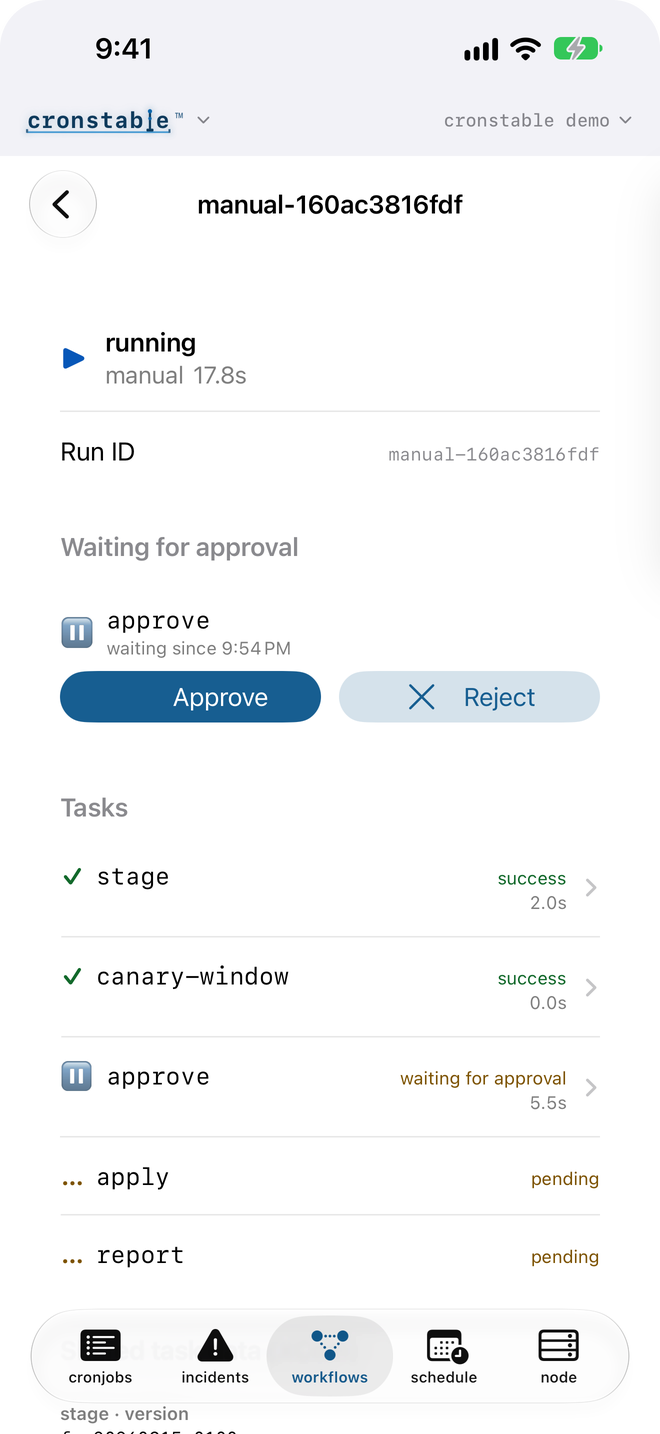
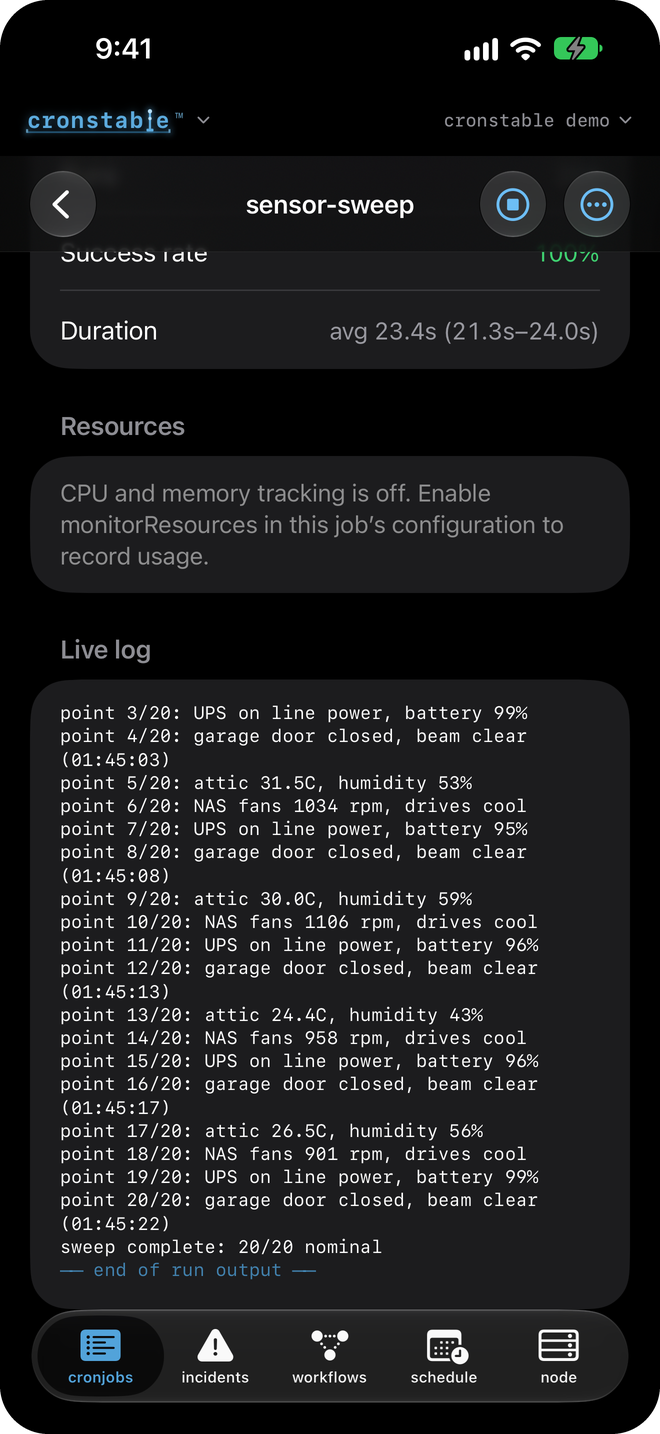
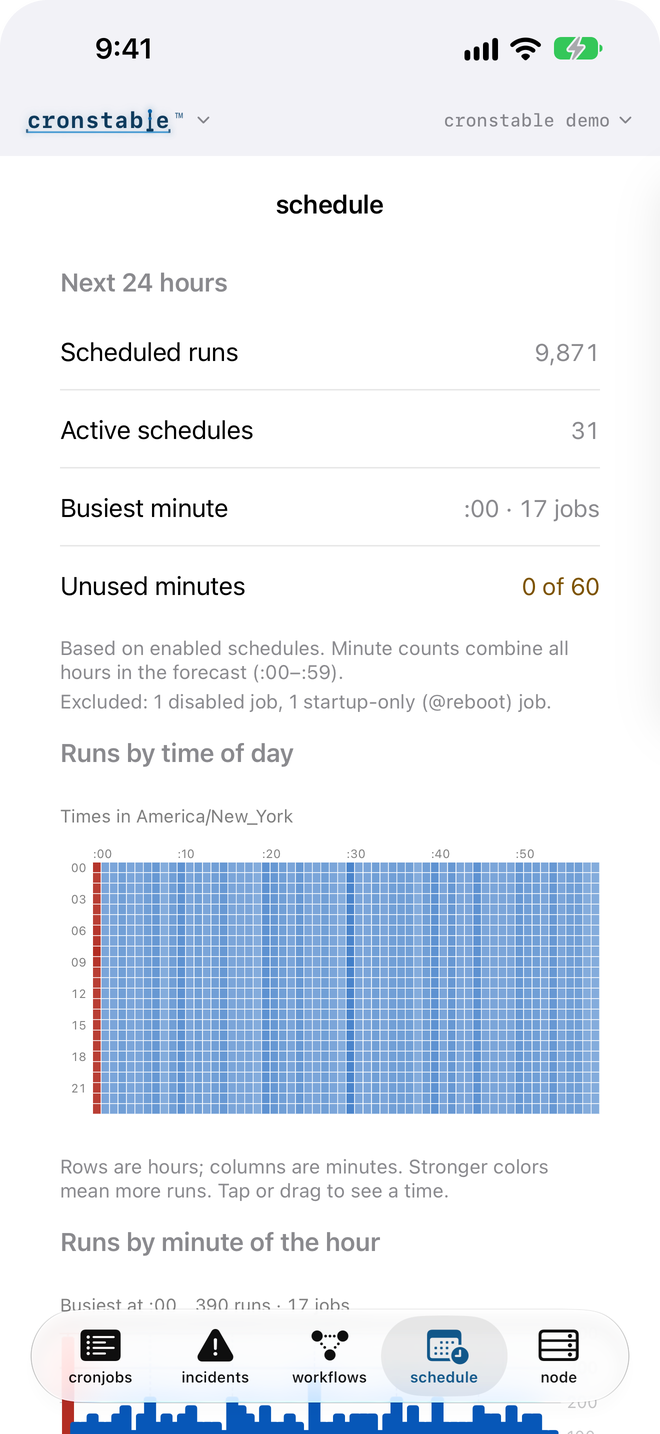
Jobs board · Approval gates · Live log tail · Schedule pressure
To connect the app to a server, follow these steps:
- Install Cronstable from the App Store.
- Enable the HTTP interface on an address that
your phone can reach, such as a LAN, Tailscale, or HTTPS address. A phone
can't reach
127.0.0.1. - Open the web dashboard at that address.
- In the command palette (
Ctrl-Kor⌘K) or in settings, select Pair a device. - Scan the QR code with the phone's camera, or tap Scan QR code in the app. The QR code contains the page's address and its access token, so pair over HTTPS or a trusted network, and give the phone a scoped token instead of the all-scopes token.
- To get lock-screen alerts, enable the
pushreporter.
If the daemon advertises itself with web.bonjour: true (see
LAN discovery),
the app can find it with Find nearby servers. You can also enter a server
address manually. To explore the app before you set up a server, tap
Try the demo on the welcome screen to connect to a live sample fleet.
The app is optional. The web and terminal dashboards, the API, and every other reporter work without it.
These four short walkthroughs build on the quick start configuration. You can copy and run each one, and each links to the wiki page that covers its topic in full.
Classic cron sends mail to root. This example instead retries with exponential backoff, and it posts to a Slack channel only if the job still fails after its last retry.
jobs:
  - name: nightly-backup
    command: /usr/local/bin/backup --incremental
    schedule: "0 3 * * *"
    captureStderr: true            # include stderr in the report
    onFailure:
      retry:
        maximumRetries: 5
        initialDelay: 5            # 5s, 10s, 20s, 40s, ... capped at 300s
        maximumDelay: 300
        backoffMultiplier: 2
    onPermanentFailure:            # fires once, after the last retry is spent
      report:
        webhook:
          url:
            fromEnvVar: SLACK_WEBHOOK_URL
By default, a job fails when it exits with a nonzero status or writes to a
captured stderr. To change that for a job, use
failsWhen. The webhook's default body is
Slack-compatible, and Mattermost and Teams accept it as is. Email, Sentry, and
shell command reports each take one more block, with Jinja2 templating over
the run's name, output, and exit code. For details, see
failure detection and retries
and reporting in the wiki.
By default, cronstable keeps no state across restarts. To handle a deploy or
a reboot in the middle of a schedule, add a state: block:
state:
  path: /var/lib/cronstable           # a local dir, or a shared mount for a fleet

jobs:
  - name: hourly-invoice-emit
    command: python -m billing.emit_hourly
    schedule: "0 * * * *"
    onMissed: run-all              # replay each hour missed while we were down
    startingDeadlineSeconds: 21600 # ...unless the slot is older than 6h
    onFailure:
      retry:
        maximumRetries: 10
        initialDelay: 30
        maximumDelay: 600
        backoffMultiplier: 2
The state.path line alone has these effects:
- Run history survives restarts, and the dashboard reloads it.
- Pending retries resume at their original deadlines.
@rebootruns once per boot instead of once per daemon start.- Prometheus counters no longer reset to zero when the daemon restarts.
The onMissed setting adds catch-up. run-once combines any number of
missed runs into one launch, and run-all replays each missed run.
startingDeadlineSeconds limits how old a missed run can be. Catch-up
applies after a restart, and also when the same daemon resumes after system
sleep or a long stall. With run-once, a regular run after the daemon resumes
counts as the catch-up run. A failed catch-up attempt counts as attempted and
doesn't schedule retries.
The same store gives job commands persistent storage and coordination tools
through a loopback endpoint: key-value storage, cursors, fleet-wide locks,
idempotency keys, artifacts, and run-scoped secrets. Your commands use them through the
cronstable state, cursor, lock, idempotent, artifact, and secret
subcommands. For details, see
durable state.
A dags: block defines a durable workflow as a directed acyclic graph (DAG)
of tasks. This example runs a build, waits for a person to approve it, and
then publishes:
state:
  path: /var/lib/cronstable           # DAGs live on the state store

dags:
  - name: release-train            # no schedule: manual-only
    tasks:
      - id: build
        command: make dist
      - id: approve
        type: approval             # waits for approval
        dependsOn: [build]
      - id: publish
        dependsOn: [approve]
        command: make publish
        retries: 2                 # task-level retries, DAG-owned
        retryDelaySeconds: 60
Trigger the DAG and approve the gate, or click Approve in the dashboard's DAG drawer instead:
curl -X POST http://127.0.0.1:8080/dags/release-train/trigger
# -> {"dag": "release-train", "runKey": "manual-..."}
curl -X POST http://127.0.0.1:8080/dags/release-train/runs/<runKey>/tasks/approve/decision \
     -H 'Content-Type: application/json' -d '{"decision": "approve", "by": "alice"}'
Workflow progress is saved in the state store, so the daemon can resume a run after a restart. Across a fleet, a lease coordinates which node advances each run. Recovery can retry an interrupted task even if its earlier process is still running. Make task side effects safe to repeat, for example by using an idempotency key.
Scheduled DAGs also support catch-up and backfill over a date range.
Tasks can pass data with cronstable xcom push and
cronstable xcom pull, fan out over a list that an upstream task produced,
and poll for conditions with type: sensor. For details, see
orchestration and DAGs.
Run the same configuration on two or more hosts that share a POSIX mount. The hosts elect a leader through a fenced lease file, without certificates or a coordination service. The mount must support locks across hosts, and every host must keep its clock synchronized with NTP:
state:
  path: /mnt/shared/cronstable/state  # shared durable state (optional but natural here)

cluster:
  backend: filesystem
  filesystem:
    path: /mnt/shared/cronstable      # the mount is the election store
  nodeName: node-a                 # unique and stable per replica!
  electLeader: true

jobs:
  - name: charge-subscriptions
    command: python -m billing.charge
    schedule: "0 6 * * *"
    clusterPolicy: Leader          # the default: exactly the leader runs it
Only the elected leader starts scheduled Leader jobs. If the leader stops,
a follower can take over after the lease is released or expires, provided it
can reach the shared mount. The lease coordinates which node can start jobs;
it does not make job side effects exactly-once. Each job's clusterPolicy
sets the behavior during a coordination failure:
Leader: skips scheduled runs when leadership cannot be confirmed.PreferLeader: allows runs when the coordination store is unreachable, so multiple replicas can run the same job.EveryNode: runs the job on every node, for work that belongs on each node.
Without a shared mount, use another backend. The gossip backend elects a
leader over mutual TLS with no shared store, kubernetes uses a
coordination.k8s.io Lease, and etcd uses a lease-bound key. To spread job
ownership across the fleet, use the gossip backend with
distribution: spread. For details, see
clustering and leader election.
Every example in example/ is a self-contained, annotated project
that you can run. Each Compose file is in its example's folder, except for the
demo quick start, which uses the root docker-compose.yml. Some highlights:
| Example | One command | What it shows |
|---|---|---|
demo |
docker compose up |
The dashboard playground: varied jobs, live logs, retries, a long-running job, and an on-demand job. |
grand-tour |
docker compose -f example/grand-tour/docker-compose.yml up --build |
Everything at once: a 9-node mTLS cluster, shared durable state, five DAG patterns, second-level probes, and all five cross-platform reporters connected to live sinks. |
cluster |
docker compose -f example/cluster/docker-compose.yml up |
A 3-node gossip cluster: peer attestation, quorum, leader election, and live failover. |
cluster-large |
docker compose -f example/cluster-large/docker-compose.yml up |
A 10-node, CPU-heavy fleet for watching distribution: spread and the load meters. |
dag |
cronstable -c example/dag |
Orchestration on a single node: dependencies, XCom, fan-out, a sensor, and an approval gate. |
dag-cluster |
docker compose -f example/dag-cluster/docker-compose.yml up |
DAGs coordinating across three nodes on one shared store, with leases and crash recovery. |
job-state |
cronstable -c example/job-state |
The state primitives for jobs: key-value storage, cursors, locks, idempotency keys, artifacts, and secrets. |
mcp |
docker compose -f example/mcp/docker-compose.yml up --build |
The MCP server: an AI agent (Claude, Cursor, Copilot) observing and driving the scheduler over POST /mcp, or the cronstable mcp stdio bridge. |
pulse-monitor |
docker compose -f example/pulse-monitor/docker-compose.yml up |
Second-level scheduling as a real-time uptime and SLA monitor. |
pulse-cluster |
docker compose -f example/pulse-cluster/docker-compose.yml up |
The same probes spread across a 3-node cluster with leader election. |
zen-demo |
docker compose -f example/zen-demo/docker-compose.yml up |
A deliberately calm board, for the wallboard's zen screensaver. |
crontab |
cronstable -c example/crontab |
Five-field user crontabs alongside YAML jobs. |
kubernetes |
kubectl apply -f example/kubernetes/deployment.yaml |
Leader election through a coordination.k8s.io/v1 Lease. |
etcd |
docker compose -f example/etcd/docker-compose.yml up |
Leader election through an etcd lease, over plain HTTP. |
docker |
docker build |
The minimal "add cronstable to your own image" recipe. |
Configuration is in YAML format. To start cronstable, give it a configuration
file or directory path as the -c argument. For example:
cronstable -c /tmp/my-crontab.yamlThis command starts cronstable, which always runs in the foreground, and reads
/tmp/my-crontab.yaml as its configuration file. If the path is a directory,
cronstable reads every *.yaml and *.yml file in it as configuration, along
with any classic crontabs (*.crontab, *.cron, or a file named crontab;
see classic crontab files).
This configuration runs a command every 5 minutes:
jobs:
  - name: test-01
    command: echo "foobar"
    shell: /bin/bash
    schedule: "*/5 * * * *"
The command can be a string or a list of strings. If command is a string,
cronstable runs it through a shell: /bin/sh by default, or /bin/bash in the
preceding example.
If command is a list of strings, cronstable runs it directly, without a
shell, and uses the list as the command's arguments:
jobs:
  - name: test-01
    command:
      - echo
      - foobar
    schedule: "*/5 * * * *"
The schedule option can be a string in the classic crontab format, which
cronstable's built-in cron engine parses. The format accepts 5, 6, or 7
fields; ranges, steps, lists, and names such as jan and mon; and Quartz's
? on its own in a day field. For the full dialect, see
schedules and time zones.
Expressions from other dialects, such as Quartz # and W or the
seconds-first 6-field layout, fail with an error that names the dialect and
explains how to convert the expression.
You can also use @reboot, which runs the job only when cronstable first
starts. The schedule option can also be an object with properties. The
following configuration runs a command every 5 minutes on July 19 each year:
jobs:
  - name: test-01
    command: echo "foobar"
    schedule:
      minute: "*/5"
      dayOfMonth: 19
      month: 7
dayOfWeek: "*"Six features answer questions about schedules, each with its own wiki page:
- Schedule linting: when cronstable loads the configuration, it flags valid
expressions that probably don't mean what they say. Examples include an
expression with no future occurrence, a schedule that sets both day of month
and day of week,
*/nsteps that don't divide evenly, and wall-clock times that daylight saving time skips or repeats. Findings appear on/jobsand/status, andGET /schedule/previewchecks any expression before it becomes a job (Schedule Linting). - Hashed schedules: an
Hfield picks a stable time from a hash of the job's name, so a fleet of hourly jobs spreads across the hour instead of all starting at:00(Hashed Schedules). - Schedule load:
GET /schedule/pressuregroups the next 24 hours of scheduled runs into a collision heatmap, which both dashboards display (Schedule Pressure). - Duplicate detection:
GET /schedule/duplicatesgroups jobs whose schedules run at exactly the same times, even when the expressions are written differently (Duplicate Schedule Detection). - Suggest a slot:
GET /schedule/suggestrecommends the least busy time for a new job, based on the fleet's actual runs (Suggest a Slot). - Why didn't it run:
GET /schedule/why?job=<name>&at=<timestamp>shows, field by field, how the scheduler's match test evaluates one job at one moment (Why Didn't It Run?).
By default, schedules have one-minute granularity, but cronstable can also run jobs at one-second granularity. You can write a second-level schedule in two equivalent ways:
- A seven-field crontab string, where the first field is the second
(
second minute hour dayOfMonth month dayOfWeek year). - The object form with a
second:property.
Both of the following jobs run every 15 seconds, at seconds 0, 15, 30, and 45 of every minute:
jobs:
  - name: every-15s-string
    command: echo "tick"
    schedule: "*/15 * * * * * *"   # 7 fields: the leading field is seconds
  - name: every-15s-object
    command: echo "tick"
    schedule:
      second: "*/15"
The seconds field accepts the same syntax as the other fields, such as *,
*/5, 0,30, and 10-20. A schedule of second: "*" or * * * * * * *
runs every second.
While any enabled job specifies seconds, the scheduler wakes once per second instead of once per minute. Minute-level jobs still run exactly once in their scheduled minute. If no job uses seconds, cronstable wakes once a minute, so the common case has no extra overhead.
Second-level scheduling is available only in YAML.
Classic crontab files keep the standard five-field,
minute-level format. A six-field string means the classic five fields plus a
trailing year field, not seconds; seconds require all seven fields.
For a runnable example, see example/pulse-monitor, a
small real-time uptime and SLA monitor that probes a service every few seconds.
Its clustered version, example/pulse-cluster, spreads
the probes across a three-node cluster that elects a leader. To start them,
run docker compose -f example/pulse-monitor/docker-compose.yml up or
docker compose -f example/pulse-cluster/docker-compose.yml up.
cronstable interprets schedules in UTC by default. To use the machine's local
time, set utc: false. For example, the following job runs every day at 19:27
local time:
jobs:
  - name: test-01
    command: echo "hello"
    schedule: "27 19 * * *"
    utc: false
    captureStdout: true
To interpret the schedule in a specific time zone, use the timezone
attribute:
jobs:
  - name: test-01
    command: echo "hello"
    schedule: "27 19 * * *"
    timezone: America/Los_Angeles
captureStdout: trueTo define environment variables for the command, use the environment
option:
jobs:
  - name: test-01
    command: echo "foobar"
    shell: /bin/bash
    schedule: "*/5 * * * *"
    environment:
      - key: PATH
        value: /bin:/usr/bin
To load environment variables from a file, use env_file:
jobs:
  - name: test-01
    command: echo "foobar"
    shell: /bin/bash
    schedule: "*/5 * * * *"
    env_file: .env
The file must contain a list of KEY=VALUE pairs. cronstable ignores empty
lines and lines that start with #.
Variables in the environment option override variables from env_file.
cronstable reads five-field user crontabs in the classic Vixie format. Export
your crontab and pass the file to -c:
crontab -l > my.crontab
cronstable -c my.crontab
System crontabs such as /etc/crontab and files in /etc/cron.d contain an
extra user column that cronstable does not parse. To preserve per-job users,
convert these entries to YAML and set each job's
user field. If all jobs should run as the
daemon's user, remove the user column from a copy of the file instead.
You can also put files named *.crontab, *.cron, or crontab in a
configuration directory next to YAML files, or load them with include:.
For example, a user crontab can contain:
SHELL=/bin/bash
PATH=/usr/local/bin:/usr/bin:/bin

# m h dom mon dow command
*/15 * * * *  /usr/local/bin/backup --incremental
30 4 * * mon-fri  /usr/local/bin/report --daily
@daily  /usr/local/bin/rotate-logs
0 0 * * *  pg_dump mydb > /backup/mydb-$(date +\%F).sql
Comments, NAME=value environment lines, nicknames such as @reboot and
@daily, and \% escapes all work as described in man 5 crontab. An
environment line applies to the entries after it, and cronstable honors
SHELL and CRON_TZ. Each entry becomes an ordinary cronstable job named
<file>:<line>, with cronstable's standard defaults rather than an emulation
of cron's environment:
- Schedules run in UTC unless the crontab sets
CRON_TZ. - A run fails when it exits with a nonzero status or writes to stderr.
cronstable doesn't send
MAILTOmail. - An unescaped
%, which cron passes to the command as standard input, causes an error when the file loads.\%still produces a literal%.
To give an entry retries, reporting, timeouts, or any other per-job option, move it to YAML. For the full mapping and every difference from cron, see classic crontabs in the wiki. For a runnable example, see example/crontab, a configuration directory that combines a crontab with YAML jobs and the dashboard.
The configuration can have a defaults section. Jobs inherit the attributes
in this section as default values, and each job can override them:
defaults:
    environment:
      - key: PATH
        value: /bin:/usr/bin
    shell: /bin/bash
    utc: false
jobs:
  - name: test-01
    command: echo "foobar"  # runs with /bin/bash as shell
    schedule: "*/5 * * * *"
  - name: test-02  # runs with /bin/sh as shell
    command: echo "zbr"
    shell: /bin/sh
    schedule: "*/5 * * * *"
Note: If the configuration path is a directory with several configuration
files, each file's defaults section applies only to the jobs in that file.
cronstable has six built-in reporters: sentry, mail, shell, webhook
(Slack-compatible with no extra configuration), push (see
push notifications), and eventlog (see
Windows Event Log). Each reporter can run on the
onFailure, onPermanentFailure, onSuccess, and onLate hooks. The mail
subject and body and the Sentry body are Jinja2 templates that can use
the run's outcome and captured output. Secrets such as DSNs, passwords, and
webhook URLs can come from value, fromFile, or fromEnvVar:
- name: test-01
  command: |
    echo "hello" 1>&2
    exit 10
  schedule:
    minute: "*/2"
  captureStderr: true
  onFailure:
    report:
      sentry:
        dsn:
          fromEnvVar: SENTRY_DSN
      mail:
        from: example@foo.com
        to: example@bar.com
        smtpHost: 127.0.0.1
        subject: Cron job '{{name}}' failed
        body: |
          {{stderr}}
          (exit code: {{exit_code}})
      shell:
        shell: /bin/bash
        command: echo "Error code $CRONSTABLE_RETCODE"
      webhook:
        url:
          fromEnvVar: SLACK_WEBHOOK_URL
A report includes the output streams that the job captures. captureStderr
is on by default, and captureStdout is off. For the capture options,
including the streamPrefix line prefix, see
output capturing.
For every reporter's options, see
Reporting in the wiki.
It covers HTML mail; Sentry fingerprints; the webhook method, headers, and
body, with per-service examples; the template variables; and the shell
reporter's CRONSTABLE_* environment variables.
The push reporter sends end-to-end encrypted alerts to devices paired with
the iOS app. The daemon seals each alert to the device's public
key before sending it. An X25519 device gets a libsodium sealed box, and an
X-Wing device gets single-shot HPKE. X-Wing is the post-quantum hybrid of
ML-KEM-768 and X25519. The hosted relay forwards each alert to the Apple Push
Notification service (APNs) and sees only ciphertext and routing metadata. It
never sees job names, hostnames, or log lines.
The reporter needs three things: the push extra
(pip install "cronstable[push]"), a daemon-wide push: section, and push
enabled on the reporting hooks. The extra includes both sealing libraries:
PyNaCl for X25519 on every platform, and cryptography for X-Wing on every
platform that cryptography publishes a wheel for. For the list of platforms,
see
Push Notifications.
The daemon lists the suites it can seal in the sealableSuites field of
GET /whoami, and the app pairs with xwing automatically when that list
includes it. If a configuration enables push without the extra or the push:
section, cronstable refuses to start, so it never drops alerts silently:
push:
  relay:
    url: https://relay.example.net/v1/notify
  devicesFile: /var/lib/cronstable/devices.json

defaults:
  onFailure:
    report:
      push:
        enabled: true
If you configure a state: section, you can omit devicesFile. Pairings are
then kept in the durable store, and every node that shares the store can see
them.
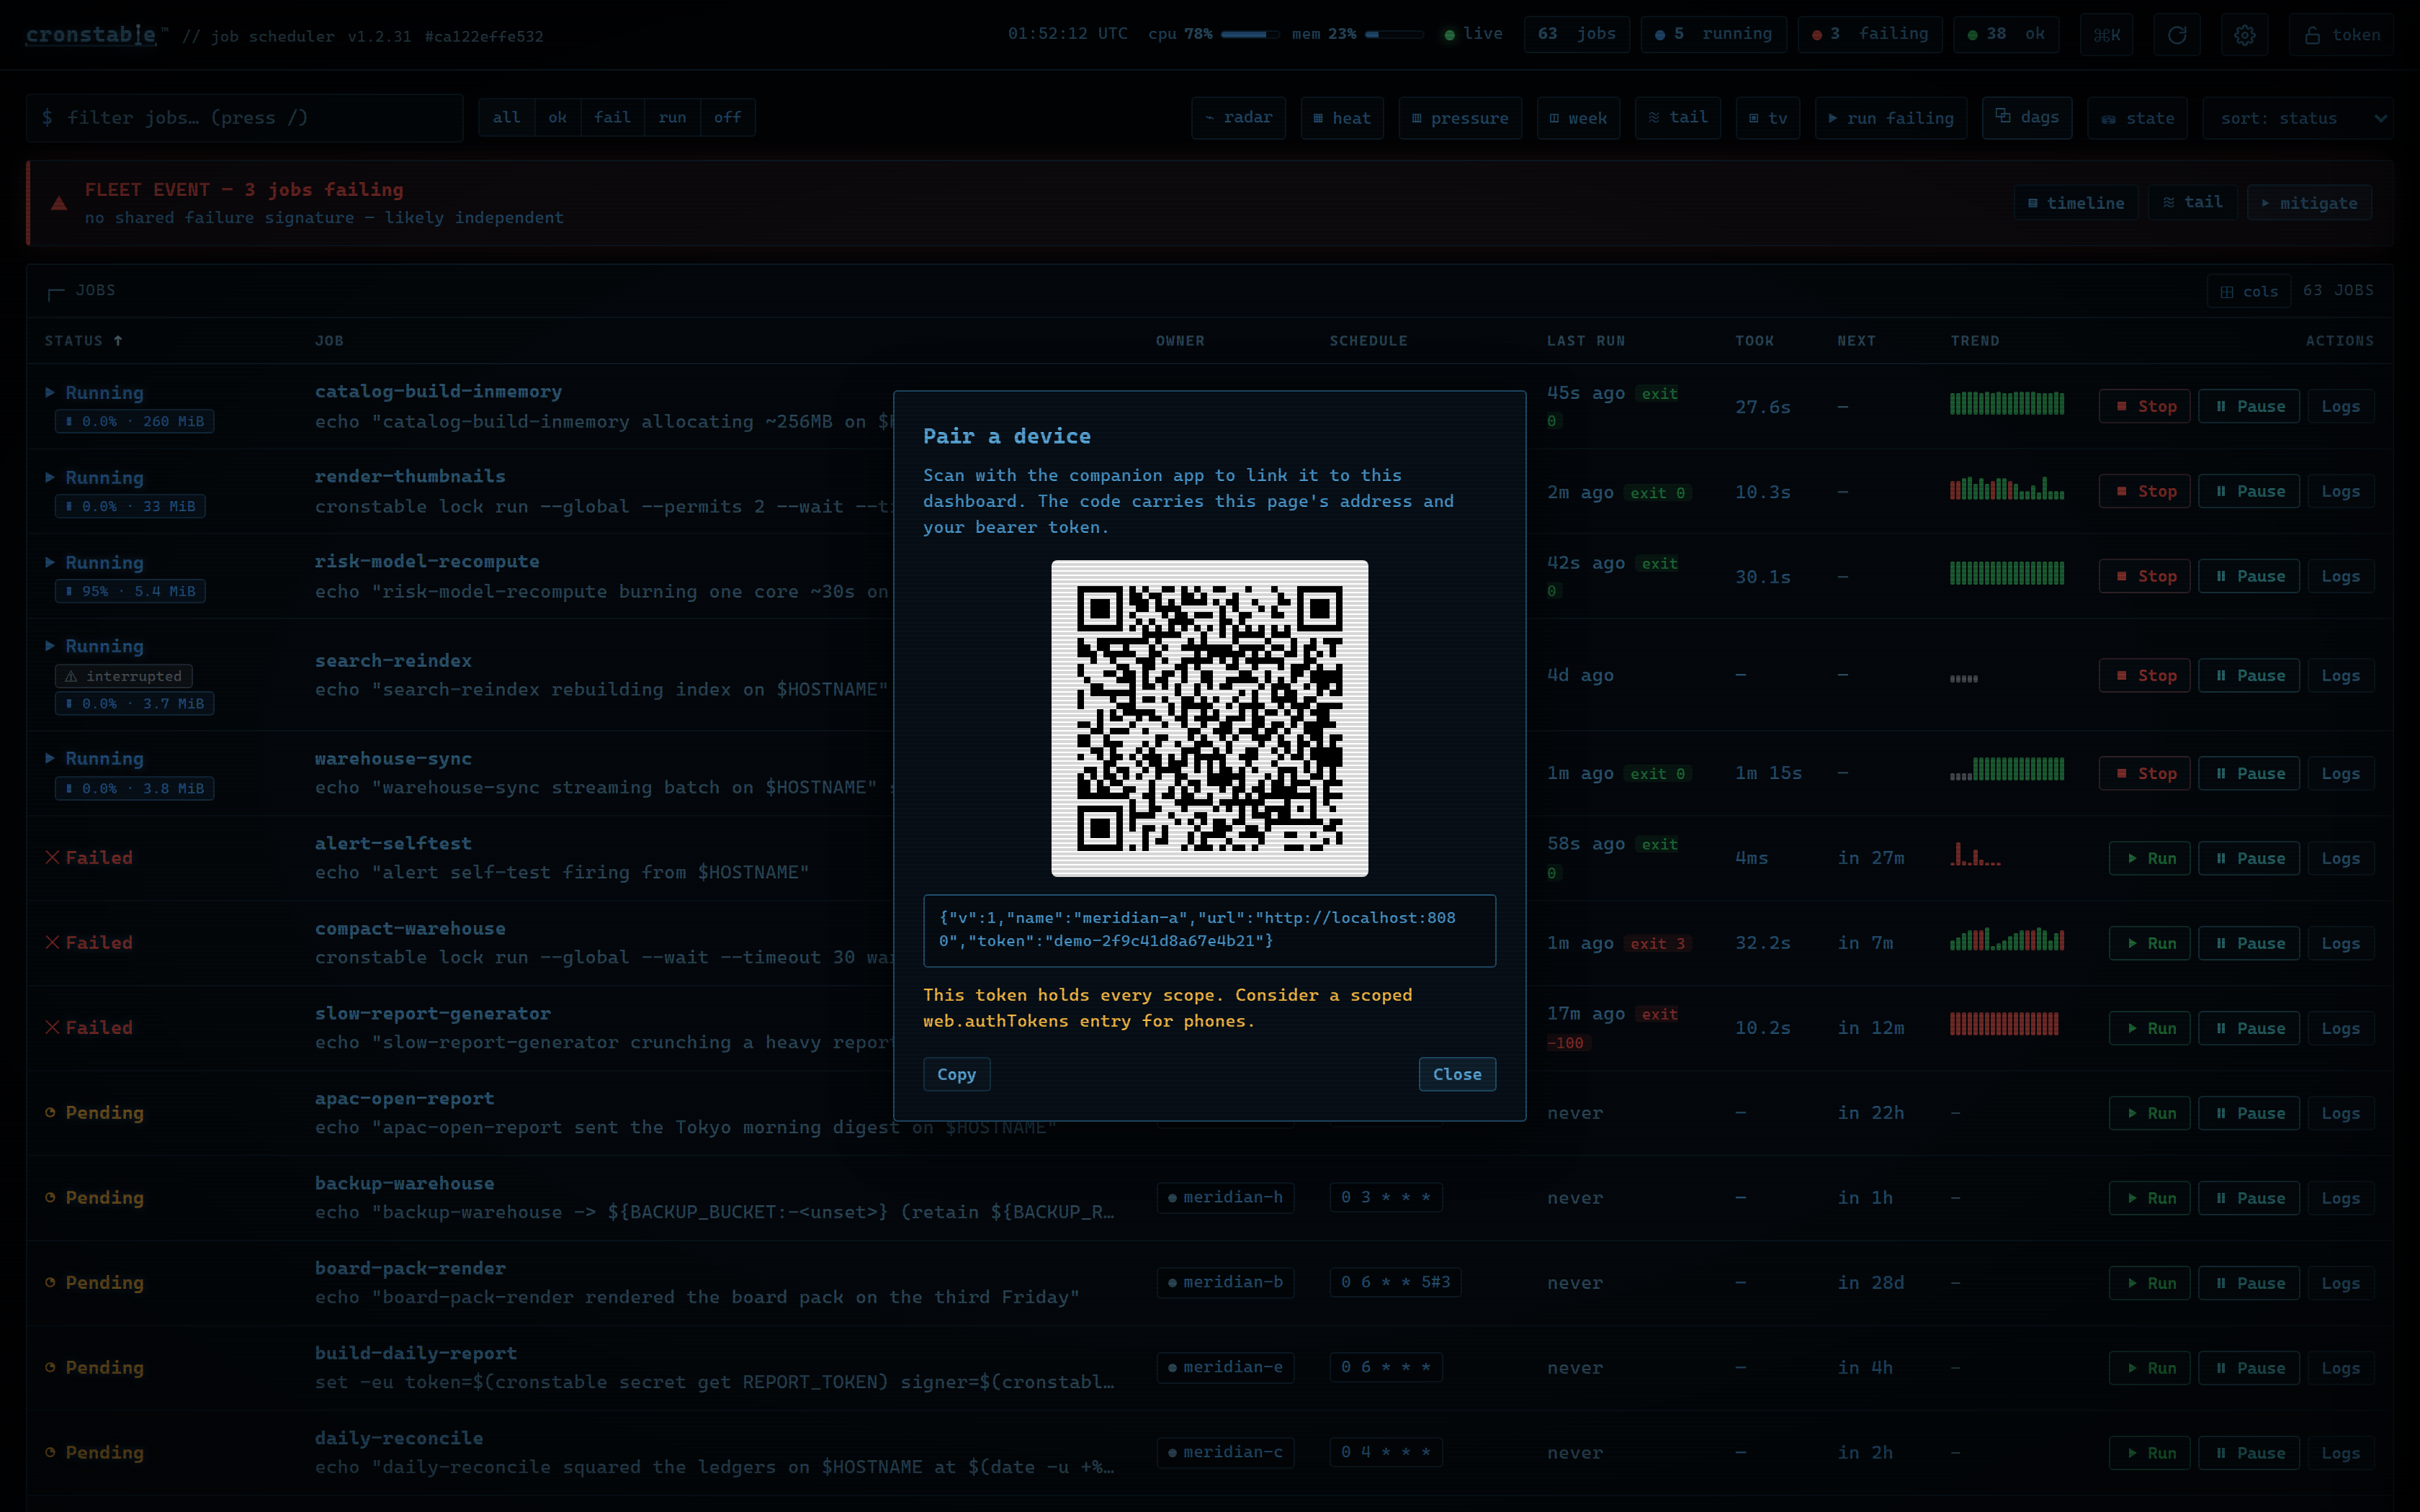
To pair a device, select Pair a device in the dashboard's command palette or settings. The QR code is a deep link: scanning it with the phone's camera opens the iOS app, or a landing page that explains how to install the app if it's missing. You can also pair with one API call:
curl -X POST -H "Authorization: Bearer $TOKEN" -H "Content-Type: application/json" \
    -d '{"name": "my-iphone", "platform": "ios", "publicKey": "<base64 X25519 key>", "pushToken": "<device push token>"}' \
    http://127.0.0.1:8080/push/devices
If you install the discovery extra and set web.bonjour: true, the daemon
also advertises the web API as a _cronstable._tcp mDNS service on the local
network. The iOS app can then find the daemon without a typed URL.
For details, see
LAN discovery in
the wiki.
For the report options, pairing and revocation, storage, size limits, and the relay trust model, see push notifications in the wiki.
On Windows, the eventlog reporter writes each outcome to the Windows Event
Log, which Windows monitoring tools already read: Event Viewer, Windows Event
Forwarding subscriptions, SCOM, and SIEM connectors. It needs no extra or
dependency. Each record has a stable event ID and a fixed set of insertion
strings, so rules that match on them keep working:
defaults:
  onFailure:
    report:
      eventlog:
        enabled: true
Get-WinEvent -FilterHashtable @{ LogName = 'Application'; ProviderName = 'cronstable'; ID = 1001, 1002 }Jobs use event IDs 1000 (succeeded), 1001 (failed), 1002 (failed
permanently), and 1003 (overdue). Daemon and orchestration events use 1010
and 1011. cronstable doesn't register its event source, so Event Viewer
prefixes the rendered text with its generic "description cannot be found"
note. The provider, ID, level, and insertion strings are unaffected, so the
XML view, wevtutil, forwarding, and SIEM connectors read the record
normally. On other platforms, the reporter does nothing, and cronstable
reports this once when it loads the configuration.
For the full ID and field tables, the optional source registration, and the reasons behind both defaults, see Windows Event Log in the wiki.
When the HTTP REST API is enabled, the daemon exposes built-in Prometheus metrics, so you don't need an exporter sidecar:
web:
  listen:
    - http://127.0.0.1:8080
The GET /metrics endpoint then serves job run outcomes, duration
histograms, retries, next-run times, configuration reload health, and cluster
and leader election state, in both the Prometheus text format and
OpenMetrics. For the full metric reference, scrape configuration, and example
alert rules, see
metrics with Prometheus.
The daemon can also push per-job metrics to statsd:
jobs:
  - name: test01
    command: echo "hello"
    schedule: "* * * * *"
    statsd:
      host: my-statsd.example.com
      port: 8125
      prefix: my.cron.jobs.prefix.test01
With this configuration, cronstable sends the following metrics over UDP to
the statsd server at my-statsd.example.com:8125:
my.cron.jobs.prefix.test01.start:1|g  # this one is sent when the job starts
my.cron.jobs.prefix.test01.stop:1|g   # the rest are sent when the job stops
my.cron.jobs.prefix.test01.success:1|g
my.cron.jobs.prefix.test01.duration:3|ms
To find out which job uses the most resources, turn on per-job resource
accounting. Set monitorResources: true on a job, as in the following
example, or set it under defaults: to cover every job:
jobs:
  - name: nightly-model-refresh
    command: python -m models.refresh
    schedule: "0 4 * * *"
    monitorResources: true
While the job runs, cronstable uses psutil to sample its whole process tree, including child processes and shell-outs. When the run ends, cronstable records its total CPU time (user plus system) and its peak resident memory. The numbers appear everywhere the run appears:
- Live, on the dashboard's job row and drawer while the job runs
(
cpu 61% · 288 MiB). - Per run and aggregated (average and maximum CPU, and peak memory) in the
dashboard's History tab and
GET /jobs/{name}/runs. - As CPU and memory charts in the dashboard's Resources tab: a live view
of the running instance, the recorded profile of any recent run, and
per-run trend strips. A node-wide history chart sits behind the header
meter (
GET /jobs/{name}/resourcesandGET /node/history). - As Prometheus metric families on
GET /metrics, such ascronstable_job_cpu_seconds_totalandcronstable_job_last_run_max_rss_bytes, and over statsd when the job has a statsd sink. - In the durable run record's
resourcesobject when a state store is configured, so the numbers survive restarts. - In report templates (
cpu_secondsandmax_rss_bytes) and the shell reporter's environment (CRONSTABLE_CPU_SECONDSandCRONSTABLE_MAX_RSS_BYTES), so a failure alert can show how large the run was when it failed.
Resource monitoring only observes: it never changes whether a run succeeds or fails. It's off by default and adds no overhead when it's off. Because the numbers are sampled, figures for short runs are approximate, but long, heavy runs are sampled many times.
To tune the sampling interval and how many chart points each run keeps, use
the map form: monitorResources: { interval: 0.5, history: 240 }. cronstable
downsamples each series in place, so even a run that lasts days stays at a few
KB. DAG tasks accept the same setting, and their usage is recorded in the task
record of the dag_run document. On a cluster, cluster.observability also
shares each node's whole-host CPU and memory use, so the dashboard's cluster
panel and fleet view show where the load is. For the full details, see the
configuration reference.
By default, cronstable considers a job failed if the process exits with a
nonzero status, or if it writes to standard error while stderr capturing is
enabled. To change this for a job, set the four Boolean fields of the
failsWhen option: producesStdout (default false), producesStderr
(default true), nonzeroReturn (default true), and always (default
false).
A retry option inside onFailure retries failed jobs with exponential
backoff. The onPermanentFailure hook reports only after all retries are used
up:
- name: test-01
  command: |
    echo "hello" 1>&2
    exit 10
  schedule:
    minute: "*/10"
  captureStderr: true
  onFailure:
    retry:
      maximumRetries: 10
      initialDelay: 1
      maximumDelay: 30
      backoffMultiplier: 2
  onPermanentFailure:
    report:
      mail:
        from: example@foo.com
        to: example@bar.com
        smtpHost: 127.0.0.1
To retry forever, set maximumRetries: -1. This is most useful with an
@reboot schedule, to restart a long-running process when it fails. By
default, retries are kept in memory, so a daemon restart forgets a pending
retry. If you configure a state: section, retries survive restarts and
resume where they left off. For details, see
failure detection and retries
and durable state
in the wiki.
Failure hooks only see runs that happened. To detect runs that are late,
missing, or taking too long, add an sla: block. Each job can set up to three
independent thresholds, and an in-process monitor checks them once per minute.
When a threshold is breached, the onLate hook runs once. It takes the same
report block as onFailure:
- name: nightly-etl
  command: python -m etl.run
  schedule: "0 4 * * *"
  sla:
    maxTimeSinceSuccessSeconds: 129600   # no success for 36h
    lateAfterSeconds: 900                # a due slot not started within 15min
    maxRuntimeSeconds: 7200              # a run still going after 2h
  onLate:
    report:
      webhook:
        url:
          fromEnvVar: SLACK_WEBHOOK_URL
Each breach produces one report, not one per minute. When the check clears,
cronstable logs a recovery line and sends no report. maxRuntimeSeconds only
observes a run and never stops it; to enforce a limit, use executionTimeout.
The monitor skips paused and disabled jobs. Under leader election, only the
node that owns the job checks it, so each breach sends a single alert.
Breaches appear as an OVERDUE badge in both dashboards, as an sla object
on GET /jobs, and as the cronstable_job_late{job_name, check} and
cronstable_job_sla_breaches_total{job_name, check} metrics. The monitor runs
inside the daemon and can't report that the daemon itself has stopped, so pair
it with an external Prometheus staleness alert. For details, see
late-run detection
in the wiki.
If a job is still running when its next scheduled run is due,
concurrencyPolicy determines what happens:
Allow(default): allows concurrent runs.Forbid: skips the next run if the previous run hasn't finished.Replace: cancels the running job and starts a new run in its place.
To stop a job after a set number of seconds, set executionTimeout. The
following job would take two seconds to finish, but cronstable stops it after
one second:
- name: test-03
  command: |
    echo "starting..."
    sleep 2
    echo "all done."
  schedule:
    minute: "*"
  captureStderr: true
  executionTimeout: 1  # in seconds
The killTimeout option sets how long cronstable waits for a job to exit
gracefully before it forces the job to stop. On Unix, cronstable sends
SIGTERM, waits up to killTimeout seconds (30 by default), and then sends
SIGKILL if the process is still running.
The following job ignores SIGTERM, so cronstable sends SIGKILL half a
second later:
- name: test-03
  command: |
    trap "echo '(ignoring SIGTERM)'" TERM
    echo "starting..."
    sleep 10
    echo "all done."
  schedule:
    minute: "*"
  captureStderr: true
  executionTimeout: 1
killTimeout: 0.5You can run a job as another user, group, or both. The user field sets the
user (UID or username) that the job's process runs as, and the group field
sets the group (GID or group name). If you set only user, the group defaults
to that user's primary group. For example:
- name: test-03
  command: id
  schedule:
    minute: "*"
  captureStderr: true
  user: www-data
To switch to another user, cronstable must run as root.
This feature is available only on POSIX systems, because it relies on setuid
and setgid. On Windows, cronstable rejects a job that sets user or group
with a configuration error; see Running on Windows.
By default, a job starts in cronstable's own working directory. To start it
in a different directory, set workingDirectory. This setting matters most on
Windows, where an elevated console starts the daemon in the system directory,
so relative paths in a script resolve to the wrong place. It's equivalent to
the Start in box on a Task Scheduler action.
- name: nightly-import
  command: import.bat
  schedule:
    minute: "0"
    hour: "2"
  workingDirectory: C:\jobs\importer
When it loads the configuration, cronstable expands ~ and ${VAR} and
makes the path absolute. The operating system checks that the directory exists
when the job starts, so a missing directory fails only that run instead of
rejecting the whole configuration. You can also set workingDirectory in a
defaults: block and on a DAG task. For details, see
commands and environment.
The priority option sets a job's scheduling priority relative to the other
processes on the machine. It has five levels: idle, below-normal,
normal, above-normal, and high.
- name: nightly-reindex
  command: reindex.sh
  schedule:
    minute: "0"
    hour: "3"
  priority: idle
On Windows, the level becomes the process's priority class when the process
is created. On POSIX systems, cronstable renices the job's process group right
after it starts the job: idle is nice 19, and high is nice -10. On both
platforms, child processes inherit a lowered priority.
On Windows, child processes don't automatically inherit above-normal or high
priority; they start at NORMAL unless configured otherwise. On POSIX
systems, cronstable adjusts the whole process group. The default, normal,
leaves the inherited priority unchanged. On POSIX systems, raising the
priority requires privileges; if the change is denied, the job continues at
its inherited priority. For details, see
commands and environment.
To control cronstable remotely, enable the HTTP API:
web:
  listen:
     - http://127.0.0.1:8080
     - unix:///tmp/cronstable.sock
When the web interface is enabled, cronstable also serves the
web dashboard at the root path (/) of every http://
listener. To expose only the REST API, set ui: false. If you set
web.authToken, the dashboard page loads without a token, and then it prompts
for one and stores it only in that browser tab.
To turn the same page into a public read-only board, add
web.anonymousScopes: [view] alongside the tokens. Requests without
credentials then get the view scope, the dashboard skips the token prompt
and shows a view-only interface, and every route that changes state still
requires a token. For details, see
public read-only access
and the
full dashboard tour
in the wiki.
The API covers these areas:
- The daemon: version, status, summary, metrics, and job-set ID
- Jobs: start, cancel, pause and resume, run history, live log tails over server-sent events (SSE), and resources
- Schedules: preview, pressure, duplicates, suggest, and why
- DAGs
- The durable state store
- Push device pairing
- The cluster and fleet views
- An iCal feed of upcoming runs
For example, the following HTTPie command pauses a job for a two-hour maintenance window:
$ http post http://127.0.0.1:8080/jobs/test-02/pause durationSeconds:=7200 note="db migration"
HTTP/1.1 200 OK

{"paused": {"since": "2026-07-19T14:00:00+00:00", "until": "2026-07-19T16:00:00+00:00", "note": "db migration", "by": "api", "channel": "api"}}
The HTTP API reference in the wiki documents every endpoint, with its request and response shapes. The repository also includes a machine-readable OpenAPI specification.
The web.listen option also accepts https:// addresses, which use the
certificate and key from a web.tls block. Each listener keeps its own
transport, so one daemon can serve the same API and dashboard in plaintext on
loopback and over TLS on a routable interface. unix:// listeners are always
plaintext; the socket's own permissions (socketMode) control access.
web:
  listen:
     - http://127.0.0.1:8080                      # loopback, plaintext
     - https://0.0.0.0:8443                       # served with the material below
  tls:
    cert: /etc/cronstable/web.pem
    key:  /etc/cronstable/web.key
    clientCa: /etc/cronstable/callers-ca.pem      # optional: require client certs
To require mutual TLS, which authenticates clients as well as encrypting
connections, set clientCa. Web certificates rotate in place without a daemon
restart. The cronstable tui and cronstable mcp clients take matching
--cacert, --client-cert, --client-key, and --insecure flags. For more
details, see the
listener TLS guide
in the wiki. It covers issuing the certificates, the mTLS trust model and how
it interacts with web.authToken, how rotation works and what it doesn't
cover, the job state API's trust anchor, and every client flag.
The job-set ID is a fingerprint of the set of jobs that a cronstable instance runs, and it doesn't depend on job order. Two instances produce the same ID exactly when they have the same set of jobs. Replicas deployed from the same configuration can compare IDs to confirm that they run the same jobs, or to detect that one has drifted from the others.
The ID is computed from each job's effective configuration, after merging, which gives it these properties:
- It doesn't depend on job order, or on whether a setting is written inline on
each job or moved into a
defaultsblock. - Equivalent schedules match: the
minute:andhour:object form produces the same fingerprint as the equivalent five-field crontab string. - It covers every field that affects behavior, such as
command,schedule,shell, the names ofenvironmentvariables, capture flags,failsWhen, retry and reporting policy,timezone, andenabled. Any meaningful change to a job changes the ID. It leaves out per-host values such asworkingDirectory, so a Windows replica and a Linux replica that run the same jobs from differently spelled paths still agree. userandgroupare fingerprinted as configured (for example,www-data), not as the resolved numeric UID or GID, which can differ between hosts.- The ID never includes secret values. Inline reporting secrets (the Sentry
DSN, the mail password, and webhook URL and header values) are redacted.
Only the names of
environmentvariables are hashed, not their values, because environment variables often hold secrets, and a per-host value, such as one fromenv_file, would make identical configurations differ across hosts. The ID is safe to log and serve, and rotating a secret or changing an environment value doesn't change it.
Because the ID reflects the effective configuration, it also reflects
platform-dependent defaults. For example, the default shell is /bin/sh on
POSIX systems and cmd.exe on Windows. Compare only instances that run on the
same platform, as replicas do. The scheme is versioned with a v1: prefix, and
IDs are comparable only within the same scheme version.
You can get the ID in three ways:
-
CLI: print the ID and exit, which is useful in scripts and health checks:
$ cronstable -c /etc/cronstable.d --job-set-id
v1:b834d7565aee0da50cd017f666651a5ba3b2e6b161daf0cb6e430f23f51ce90b
-
HTTP: call
GET /job-set-idon the web interface, which also supportsapplication/json. The dashboard header shows the ID too:$ http get http://127.0.0.1:8080/job-set-id v1:b834d7565aee0da50cd017f666651a5ba3b2e6b161daf0cb6e430f23f51ce90b $ http get http://127.0.0.1:8080/job-set-id Accept:application/json {"job_set_id": "v1:b834d7…51ce90b", "jobs": 3} -
Logs: cronstable logs the ID once at startup, and again whenever a configuration reload changes it.
By default, cronstable runs as a single instance, and every replica runs every
job. An optional cluster section lets several replicas coordinate. With the
default gossip backend, each node serves a small GET /peer endpoint over
mutual TLS and periodically polls its configured peers. The nodes compare
job-set IDs to confirm that they run the same set of jobs, which
is called cluster peer attestation. If you
turn on electLeader, the nodes also use that attestation to elect a leader,
which requires a quorum. The following configuration uses the default
gossip backend. It coordinates scheduled jobs across replicas, but can
duplicate or skip runs during failures or changes in cluster membership:
cluster:
  listen: "0.0.0.0:8443"          # the mTLS listener for this node
  tls:
    ca:   /etc/cronstable/cluster-ca.pem   # trust anchor for peer certificates
    cert: /etc/cronstable/this-node.pem    # this node's certificate
    key:  /etc/cronstable/this-node.key
  peers:
    - host: cronstable-b.internal:8443
    - host: cronstable-c.internal:8443
  nodeName: cronstable-a              # optional; defaults to the system hostname
  interval: 30                    # optional; seconds per round (default 30)
  connectTimeout: 10              # optional; per-peer connect timeout (default 10)
  driftAfter: 3                   # optional; rounds before "drifted" (default 3)
  electLeader: true               # observe-only if false (the default)
Each node independently chooses as leader the member with the lowest
nodeName among the members that it currently sees agreeing on the job-set
ID. It chooses a leader only if those members form a quorum (a strict
majority) of the cluster. Because peer views can differ or become stale,
multiple nodes can consider themselves leader. This election is best effort:
the default gossip backend keeps no shared state. To coordinate
leadership through a shared lease, set
cluster.backend: kubernetes or cluster.backend: etcd to elect through a
coordination.k8s.io/v1 Lease or a lease-bound etcd key. The filesystem
backend uses a shared mount with locks across hosts and bounded clock skew,
as shown in tutorial 4. These backends
fence leadership while the coordination store is reachable; jobs can still
miss runs, and the lease does not make their side effects exactly-once.
Each job can override the cluster-wide default with its own clusterPolicy,
which controls how it runs during coordination failures. Leader, the
default, skips runs when leadership cannot be confirmed. PreferLeader
allows runs without confirmed leadership, so multiple replicas can run the
same job. EveryNode runs the job on every node.
The GET /cluster endpoint returns the current view: members, the elected
leader, quorum, and any conflicts. The dashboard shows the same view in a
panel. For the full trust model, per-peer status table, quorum math, sizing
guidance, distribution: spread load balancing, and the fenced lease
backends, see the
clustering and leader election
guide in the wiki. To watch leader election in the dashboard, try a cluster
from the example gallery.
Use include to share defaults and other configuration across files. It
accepts a list of filenames, which cronstable parses and merges into the
current configuration.
For example, here's the main configuration:
include:
  - _inc.yaml

jobs:

  - name: my job
    ...
Here are the shared defaults in _inc.yaml:
defaults:
  shell: /bin/bash
  onPermanentFailure:
    report:
      sentry:
...Any string value in the configuration can read cronstable's environment
variables with ${VAR}, or with ${VAR:-default} to set a fallback. One
configuration file can then serve many environments without a wrapper script
that templates it. To write a literal $, use $$.
Interpolation runs after the file is validated, so it works in any string
field, such as a listen address, a state path, a time zone, or a webhook URL.
If a ${VAR} is unset and has no default, cronstable reports a configuration
error that names the variable, and cronstable --validate-config catches it.
web:
  listen:
    - "0.0.0.0:${WEB_PORT:-8080}"   # port from the environment, default 8080
state:
  path: ${STATE_DIR}               # required: unset fails --validate-config
jobs:
  - name: rollup-${REGION}
    command: run-rollup             # ${VAR} in a command is left for the shell
    schedule:
      minute: "0"
    timezone: ${TZ:-UTC}
The daemon doesn't interpolate the command and shell of jobs and
reporters, so the shell expands their ${VAR} references at run time against
the job's own environment, not the daemon's. The daemon also leaves the
logging section for Python's logging.config. For the full rules, including
how interpolation affects the job-set ID, see
environment variable interpolation.
To customize logging, add a logging section. For example, the following
configuration adds a timestamp to each log line:
logging:
  # In the format of:
  # https://docs.python.org/3/library/logging.config.html#dictionary-schema-details
  version: 1
  disable_existing_loggers: false
  formatters:
    simple:
      format: '%(asctime)s [%(processName)s/%(threadName)s] %(levelname)s (%(name)s): %(message)s'
      datefmt: '%Y-%m-%d %H:%M:%S'
  handlers:
    console:
      class: logging.StreamHandler
      level: DEBUG
      formatter: simple
      stream: ext://sys.stdout
  root:
    level: INFO
    handlers:
- consoleJobs are enabled by default. To disable a job, add enabled: false.
cronstable validates disabled jobs but skips their execution.
jobs:
  - name: test-01
    enabled: false  # this cron job will not run until you change this to `true`
    command: echo "foobar"
    shell: /bin/bash
schedule: "* * * * *"Every feature has its own page in the wiki, and the wiki's sidebar is the full index. Good places to start are Installation, the Configuration Reference, the Web Dashboard tour, and Troubleshooting.
Bug reports, feature ideas, and pull requests are welcome. For the development setup and how to sign off your commits under the Developer Certificate of Origin (DCO), see CONTRIBUTING.md. For how releases work, see Contributing and Releasing.
The performance benchmarks compare speed and memory use against the latest release on every commit to catch regressions before release.
cronstable is MIT-licensed; for how the repository's licensing is organized, see LICENSING.md.
Security. Report vulnerabilities privately, not in a public issue. SECURITY.md describes the disclosure process, what's in scope (including the hosted relay and the public demo), and what to expect.
Trademarks. The MIT License covers the code, not the brand. cronstable™ and the cronstable logo are trademarks of Parker Loflin; see TRADEMARKS.md. The rendered logo artwork is also excluded from the MIT grant, but the code that draws it is MIT-licensed; see Brand assets.
cronstable is a fork of yacron by Gustavo Carneiro, and it continues development from yacron version 0.19.