Repository navigation
Cascadia dashboards for TEL, MDI, DRD and STR - #206
Merged
Merged
Conversation


Ports the diagnostics added to firmware_v4 in October (and to
brightside.dbc only) into cascadia.dbc, with layouts checked against
firmware origin/main ecd8735:
- TEL 0x764: TELMCUHealth (MCU_Voltage mV, MCU_Temperature degC) replaces
  CPULoad; no firmware sends a CPU load (tel/app/diagnostics.c:74-93)
- TEL 0x751: MCUOvertemp, MCUUndervoltage bits 5-6
- MDI 0x501: MDIRTDFault, MDIRTDCommError bits 3-4
- MDI 0x502: DLC 6, RTDFaultFlags byte 5 (+ value table)
- DRD 0x402: new DRDMCUHealth; 0x403 DRDMCUOverTemp/UnderVoltage bits 38-39
- STR 0x591 STRMCUHealth, 0x592 STRFlags (bit0 undervoltage, bit1 overtemp
  per str/app/diagnostic_app.h; brightside.dbc has these reversed)
Temperatures are int16 (signed) as sent by firmware.

Co-Authored-By: Claude Opus 5.5 <noreply@anthropic.com>
- CAN_Msg.py and randomizer.py imported CAR_DBC by value, so
  link_telemetry --dbc changed nothing: decoding and random generation
  always used brightside.dbc. Read parameters.CAR_DBC at call time.
- decode with decode_choices=False (CAN_Msg, cellular_parser): signals
  with a VAL_ table decode to NamedSignalValue, which influxdb_client
  rejects, failing the whole batch. cascadia.dbc has 29 VAL_ tables.
  Grafana maps the raw ints back to names.

Co-Authored-By: Claude Opus 5.5 <noreply@anthropic.com>
One layout for all four boards: health and faults on top (link
freshness, uptime, MCU health with firmware fault limits, one fault
strip), then grouped trends and state timelines, units on every numeric
panel. TEL adds GPS position/status/motion. Generated with the
clbears-hmi-design sunskill (telemetry-hmi) and checked against
cascadia.dbc and live random data. Brightside dashboards are unchanged.

Co-Authored-By: Claude Opus 5.5 <noreply@anthropic.com>
tools/cascadia_sim: realistic, adjustable TEL/MDI/DRD/STR data for testing
dashboards. Frames use firmware IDs, rates and fault logic, are encoded and
decoded with cascadia.dbc, and written with sunlink's InfluxDB layout. Tk
window with sliders/toggles per board and 13 preset scenarios (GPS lost,
motor overheat, RTD failure, STR brownout, link down, ...). Headless mode
for scripted runs. Refuses non-localhost InfluxDB unless --allow-remote.

Dashboards: MCU Vdd shown in mV (Grafana rescaled to whole volts), motor
temperature axis starts at 0.

Co-Authored-By: Claude Opus 5.5 <noreply@anthropic.com>
One page on localhost:8090 (stdlib http.server, bound to 127.0.0.1):
one-click scenario buttons, toggle buttons, sliders with firmware limits
highlighted, action buttons (reboot, motor temp jumps), live readout and
links to each board's dashboard. Now the default; --tk keeps the Tk window.

Co-Authored-By: Claude Opus 5.5 <noreply@anthropic.com>
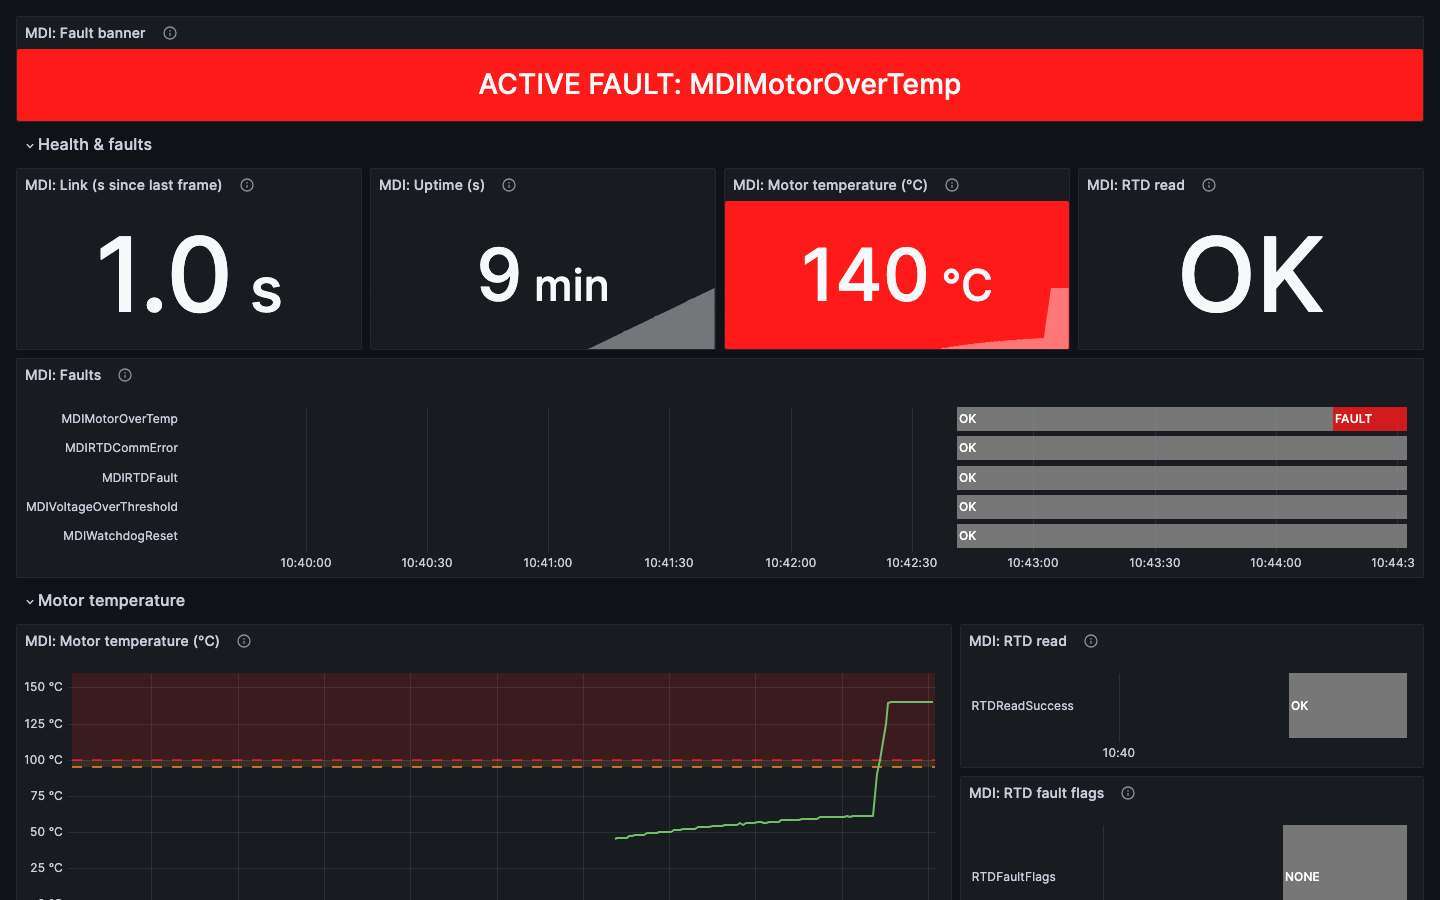
Saturated red, white bold text on a red pill with glow for out-of-limit
values, active fault toggles and motor OVERTEMP.

Co-Authored-By: Claude Opus 5.5 <noreply@anthropic.com>
…normal

Co-Authored-By: Claude Opus 5.5 <noreply@anthropic.com>
Red ACTIVE FAULT if any fault bit is set in the latest frame, yellow
FAULT IN WINDOW if one was set in the time range shown but has cleared,
NO FAULTS otherwise. Sits left of each fault strip.

Co-Authored-By: Claude Opus 5.5 <noreply@anthropic.com>
Each fault row is OK until it faults, FAULT (red) while set, then CLEARED
(yellow) for the rest of the time range shown. Removes the separate
fault status tile.

Co-Authored-By: Claude Opus 5.5 <noreply@anthropic.com>
Blank until a fault bit is set, then solid red 'ACTIVE FAULT: <signals>'
across the top of the board, for peripheral vision. Stat tiles use a
solid fill. MCU Vdd tile no longer turns red when there is no data.

Co-Authored-By: Claude Opus 5.5 <noreply@anthropic.com>
Resets inputs to the normal scenario, clears the motor overtemp latch and
RTD fault counter, and deletes the simulated TEL/MDI/DRD/STR data written
since 2026-10-01 from the local bucket, so old faults no longer show as
CLEARED. Older data (e.g. copied real logs) is kept. Button in the browser
panel and the Tk window. Writes and the delete share a lock.

Co-Authored-By: Claude Opus 5.5 <noreply@anthropic.com>
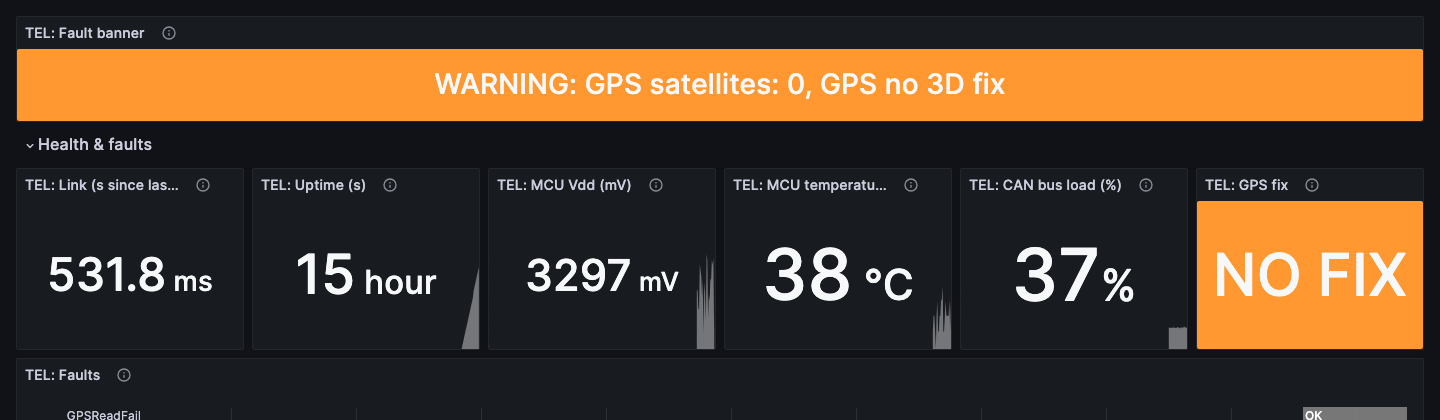
Banner now also shows orange WARNING for abnormal conditions that are not
fault bits: link lost, board rebooted < 60 s ago, GPS < 4 satellites or no
3D fix, CAN bus load >= 70 %, motor RTD not reading, motor temperature in
the 95-100 degC caution band, DRD cyclic-data timeouts, DRD drive state
INVALID. Red (faults) takes priority and lists warnings after.

cascadia_sim: fewer than 4 satellites degrades a 3D fix to 2D, fewer than
3 to no fix.

Co-Authored-By: Claude Opus 5.5 <noreply@anthropic.com>
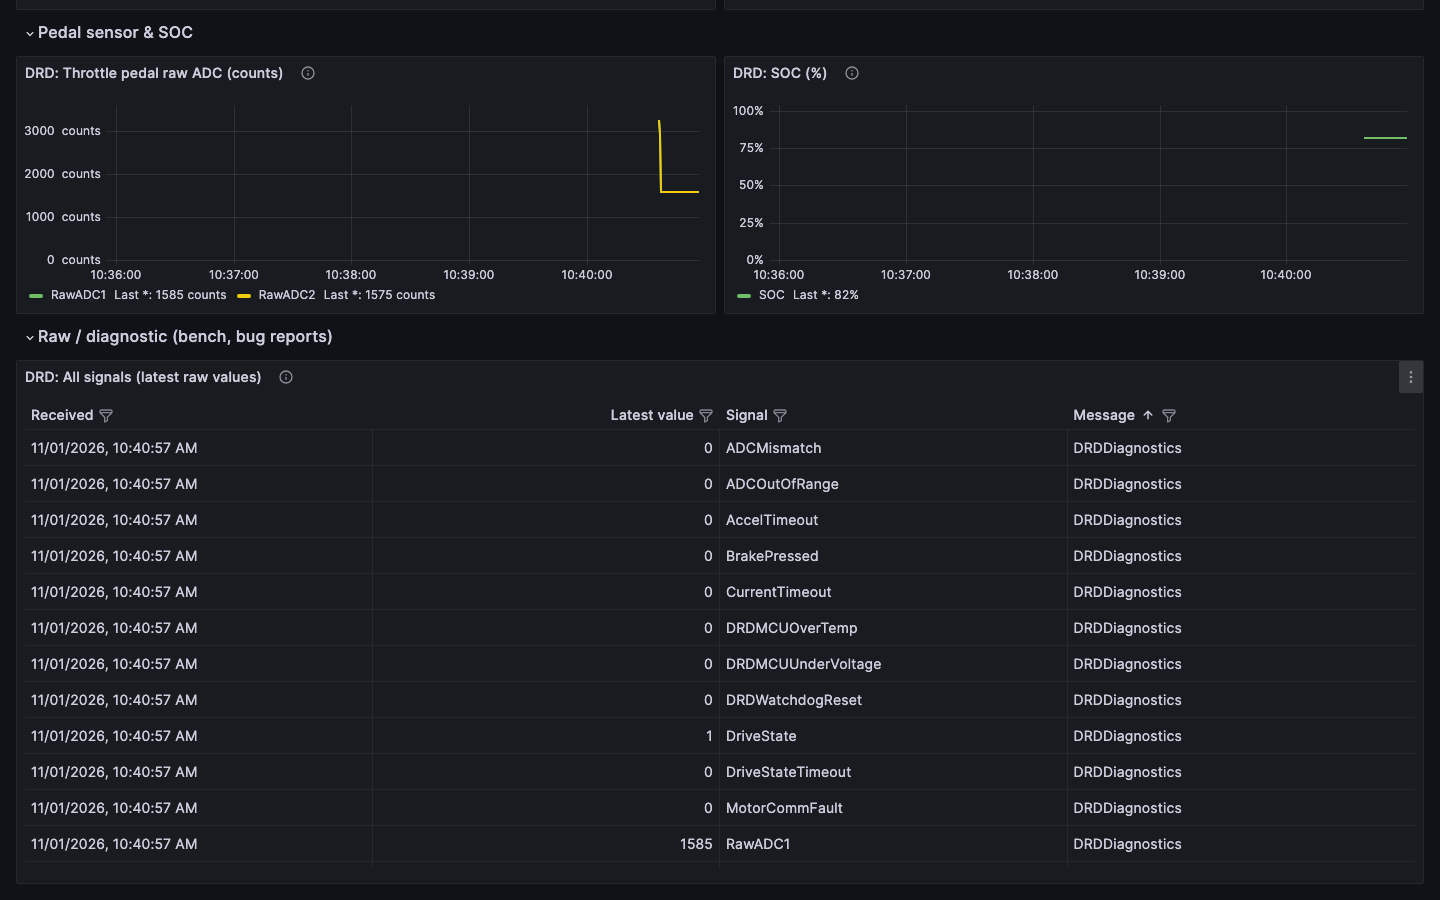
From the user interview (pit crew + embedded on the bench; reboot/swap
boards and file bugs): a collapsed table of every signal the board sent,
with its latest value and arrival time. First screen (banner, health,
fault strip) checked to fit a laptop at 1440x900.

Co-Authored-By: Claude Opus 5.5 <noreply@anthropic.com>
images/cascadia_dashboards: the four boards in normal operation, an active
fault with a warning and a cleared fault (DRD), a GPS warning (TEL), motor
overtemp (MDI), the raw diagnostic row and the simulator panel. Taken from
the local stack fed by tools/cascadia_sim.

cascadia_sim: motor model capped at 140 degC so runaway heating stays
plausible.

Co-Authored-By: Claude Opus 5.5 <noreply@anthropic.com>

clbears
marked this pull request as ready for review
November 1, 2026 18:21
Every simulated point now carries source=cascadia_sim and 'Reset
everything to normal' deletes only points with that tag. Before, reset
deleted all TEL/MDI/DRD/STR data after 2026-10-01 in the target bucket,
which would also wipe real logs imported into a local stack. Dashboards
ignore the tag.

Co-Authored-By: Claude Opus 5.5 <noreply@anthropic.com>

gregorybian
reviewed
Nov 2, 2026
gregorybian
reviewed
Nov 2, 2026
Co-Authored-By: Claude Opus 5.5 <noreply@anthropic.com>
Takes parser/cellular_parser.py, parser/data_classes/CAN_Msg.py and
parser/randomizer.py back to main. This undoes 71c05ae.

Co-Authored-By: Claude Opus 5.5 <noreply@anthropic.com>
gregorybian
approved these changes
Nov 3, 2026
The parser changes are out of this PR, so the parser on main decodes
enum signals to names while the simulator stores raw ints. Say what the
simulator does instead.

Co-Authored-By: Claude Opus 5.5 <noreply@anthropic.com>
This file contains hidden or bidirectional Unicode text that may be interpreted or compiled differently than what appears below. To review, open the file in an editor that reveals hidden Unicode characters.
Learn more about bidirectional Unicode characters
Sign up for free
to join this conversation on GitHub.
Already have an account?
Sign in to comment


Add this suggestion to a batch that can be applied as a single commit.This suggestion is invalid because no changes were made to the code.Suggestions cannot be applied while the pull request is closed.Suggestions cannot be applied while viewing a subset of changes.Only one suggestion per line can be applied in a batch.Add this suggestion to a batch that can be applied as a single commit.Applying suggestions on deleted lines is not supported.You must change the existing code in this line in order to create a valid suggestion.Outdated suggestions cannot be applied.This suggestion has been applied or marked resolved.Suggestions cannot be applied from pending reviews.Suggestions cannot be applied on multi-line comments.Suggestions cannot be applied while the pull request is queued to merge.Suggestion cannot be applied right now. Please check back later.
Cascadia dashboards for TEL, MDI, DRD and STR
Rebuilds the four board dashboards for Cascadia, fixes
cascadia.dbcwhere it disagrees with firmware, and adds a scenario simulator for testing dashboards without the car. The Brightside dashboards are unchanged.Tested with simulated data and with real Cascadia data from the 2026-10-24 bench integration test (see Testing).
Layout (same on all four boards)
docs/GRAFANA.md. Fixed uidscascadia-prod-{tel,mdi,drd,str}, and a link bar to switch between the Cascadia boards.More screenshots: GPS warning, motor overtemp, raw diagnostic row, simulator
TEL, GPS lost (warning, not a fault)
MDI, motor past 100 °C (fault)
DRD, raw diagnostic row expanded
Simulator control panel (
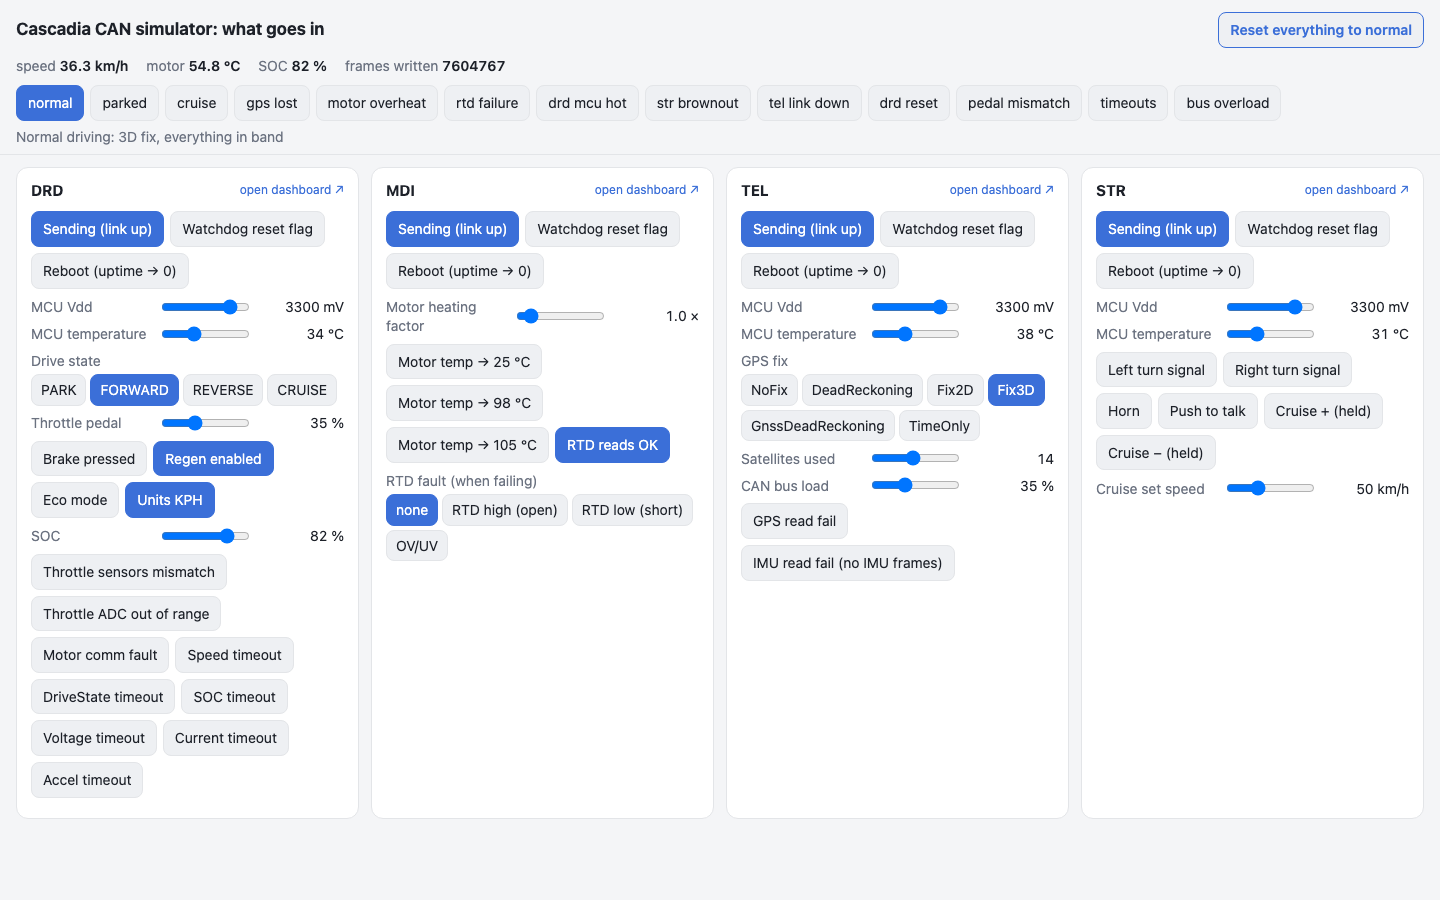
tools/cascadia_sim)DBC changes (
dbc/cascadia.dbc), checked against firmware_v4origin/mainecd8735TELMCUHealth(MCU_Voltage mV, MCU_Temperature °C) replacesCPULoad; no firmware sends a CPU loadtel/app/diagnostics.c:74-93MCUOvertemp,MCUUndervoltage(bits 5-6)tel/app/diagnostics.hMDIRTDFault,MDIRTDCommError(bits 3-4)mdi/app/diagnostic.h:14-23RTDFaultFlags(byte 5) and a value tablemdi/app/diagnostic.c:96-131DRDMCUHealthdrd/app/diagnostic.c:142-157DRDMCUOverTemp,DRDMCUUnderVoltage(bits 38-39)drd/app/diagnostic.h:20-32STRMCUHealth,STRFlags(bit 0 = undervoltage, bit 1 = overtemp; brightside.dbc has them reversed)str/app/diagnostic_app.{c,h}scripts/check_dbc.pypasses. A hand-packed frame for each changed message decodes to the value the firmware encodes.Panels from the Brightside boards that were dropped or renamed
GPSLatitude/Longitude/Fix/SatCountare nowGpsLatitude,GpsLongitude,GpsFixTypeandGpsSatsUsed.SpeedUnitKPHis nowMotorCommand.SpeedUnits.MCUVoltage/MCUTemperature/MDIOverVoltageare dropped: MDI has no MCU-health code, and 0x503 carries the commit hash.STRWatchdogResetis dropped: nothing sends 0x582.Simulator (
tools/cascadia_sim, separate commits, can be dropped)Realistic, adjustable TEL/MDI/DRD/STR data for testing dashboards without the car. Frames use firmware IDs, rates and fault thresholds, are encoded and decoded with
cascadia.dbc, and are written with sunlink's InfluxDB layout.source=cascadia_sim, and reset deletes only those points. Real logs imported into the same local bucket are never touched. Dashboards ignore the tag.--allow-remoteis passed.firmware_v4/tools/Simulate_CAN_Bus(also in sunlite) replays fixed raw payloads from YAML onto a real CAN bus (socketcan). It is for bus timing, load and startup tests on hardware.drd/test/test_scripts/simulate_mc.pyfakes the motor controller for DRD bench tests.Design basis (user interview, 2026-10-31)
The layout follows situation-awareness and high-performance HMI principles (Endsley 1995, PAS High Performance HMI, Wickens 2008, FAA HF-STD-001B).
Testing
CAN_prodon the Sunlink laptop used for that test (ckalitin-victus, 19:39–23:47 UTC). On a 30-minute slice (603k points), every panel whose signal was decoded shows real data, and the banners catch the real bench problems from that day:CPULoad, reading about 2e-39. Re-decoded with this PR's layout, the same 28 frames give MCU_Voltage 3419–3467 mV and MCU_Temperature 21–25 °C. The slightly high voltage fits the uncalibrated TEL ADC noted below.CAN_log).🤖 Generated with Claude Code