


- Overview
- Features
- Skills Demonstrated
- Dataset
- Requirements
- How to Run Locally
- Live Deployment
- Project Workflow
- Learning Outcomes
- Screenshots
- Author
- License
This project is a comprehensive analysis of COVID-19 research papers using the CORD-19 dataset. The goal was to explore and visualize patterns in the dataset and build an interactive Streamlit web application to make the insights accessible in a dynamic and user-friendly way.
It demonstrates data cleaning, feature engineering, visualization, and machine learning classification skills in Python.
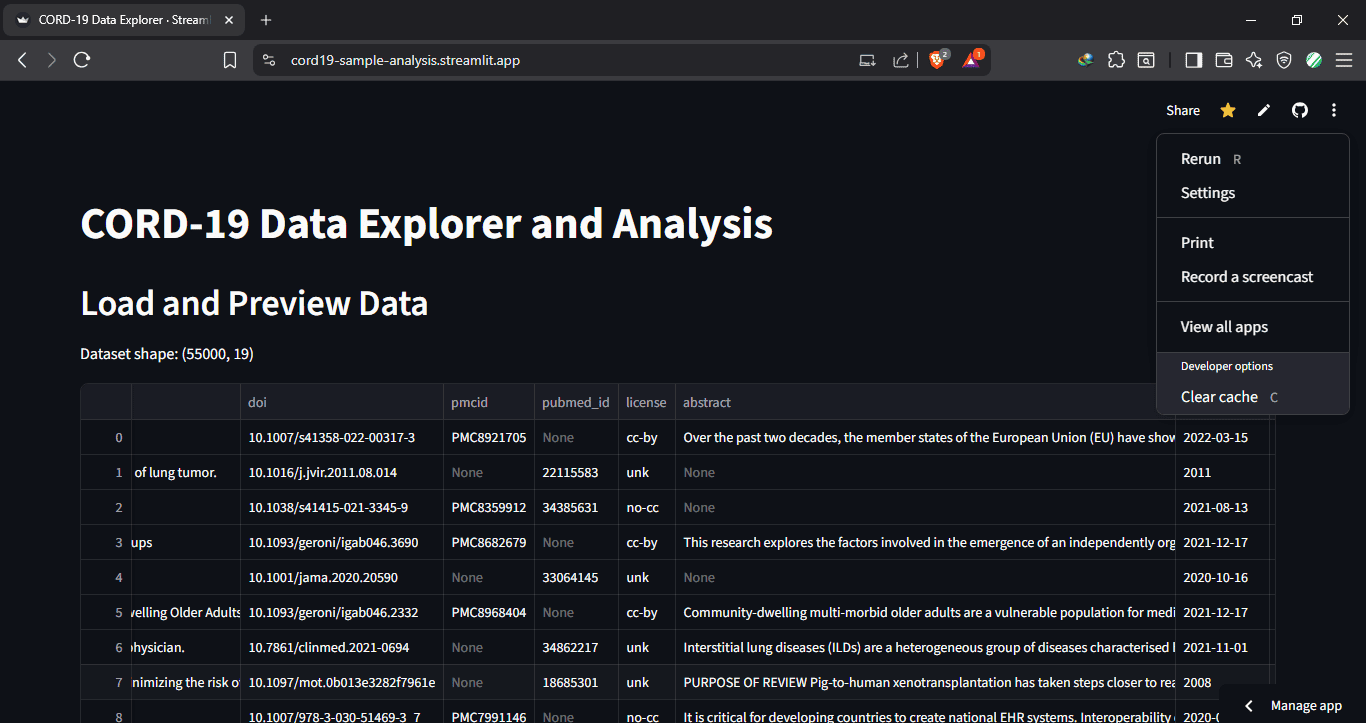
- Load the sample CORD-19 metadata CSV file using
pandas. - Explore the dataset shape, column types, and missing values.
- Preview the first few rows of data directly in the web app.
- Handle missing data in numeric and categorical columns.
- Convert publication dates to datetime and extract
publish_year. - Create new features:
abstract_word_counttitle_word_countnum_authors
- Reduce journal categories to top publishers for better analysis.
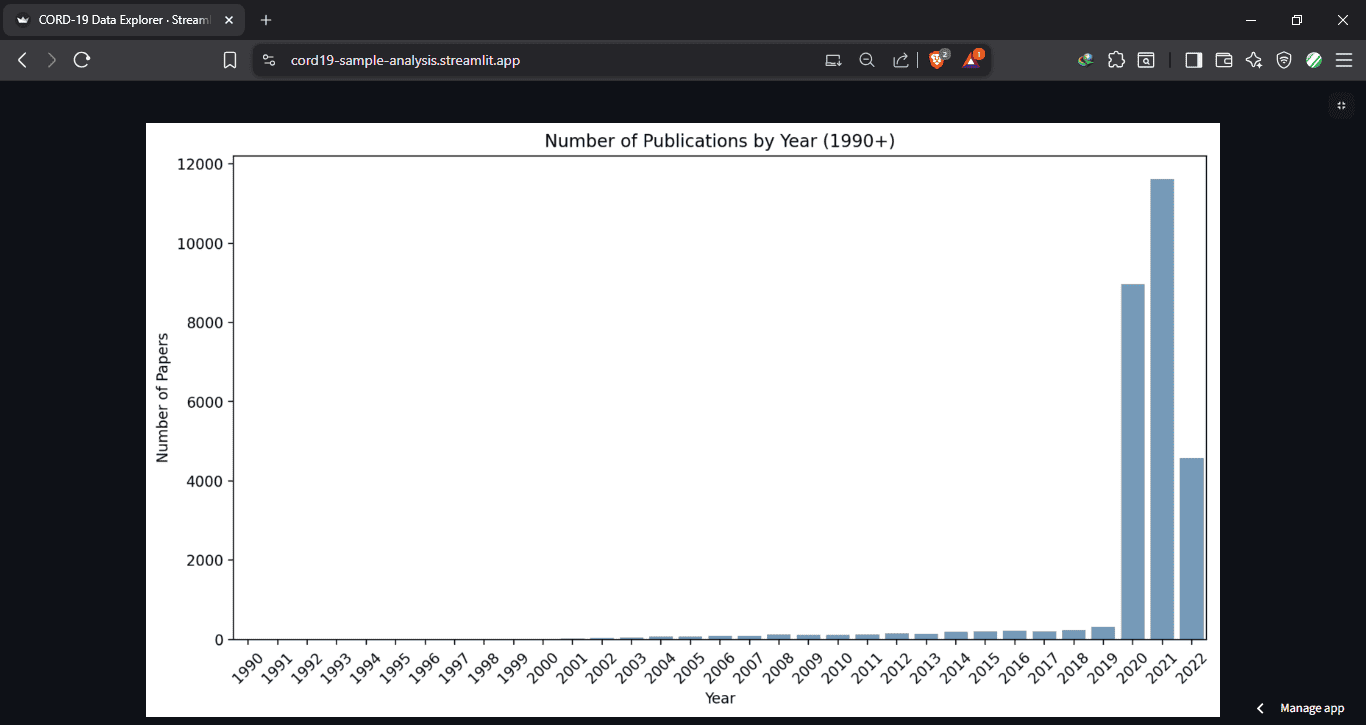
- Publications Over Time: Interactive bar chart showing number of papers per year since 1990.
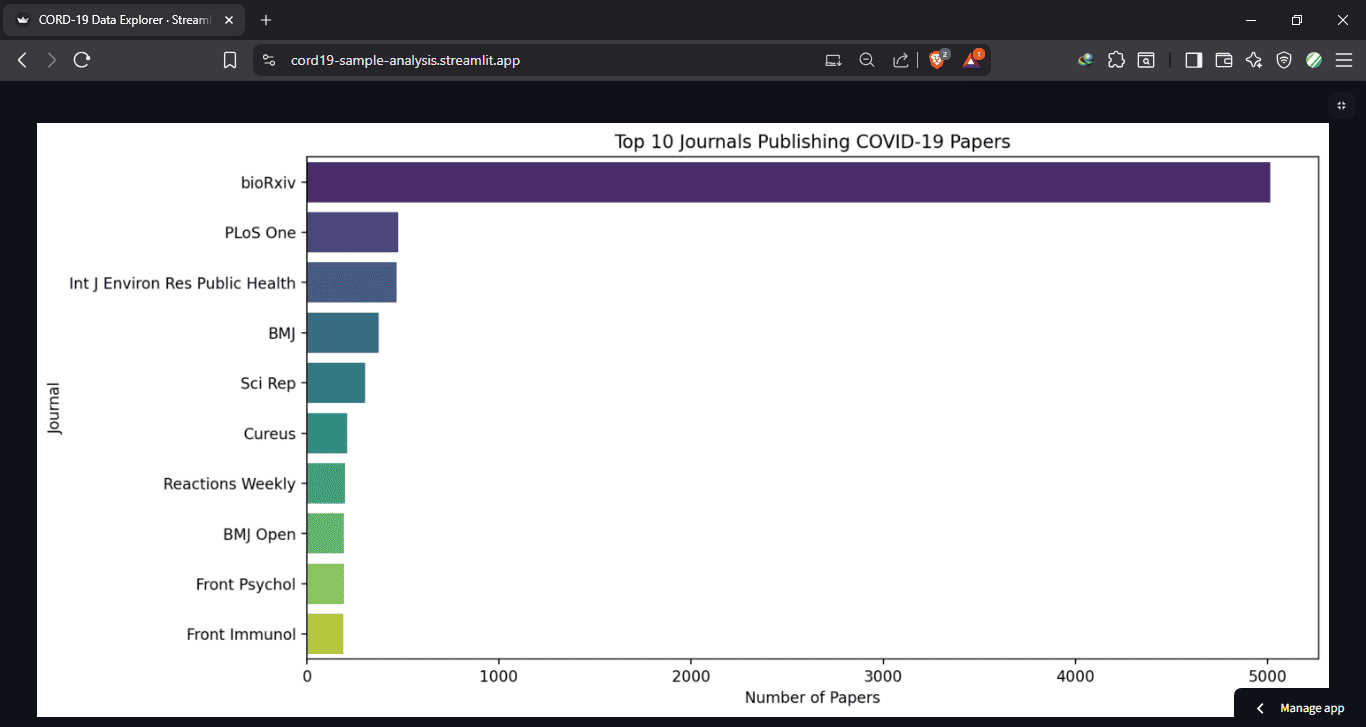
- Top Journals: Horizontal bar chart of the 10 most prolific journals publishing COVID-19 papers.
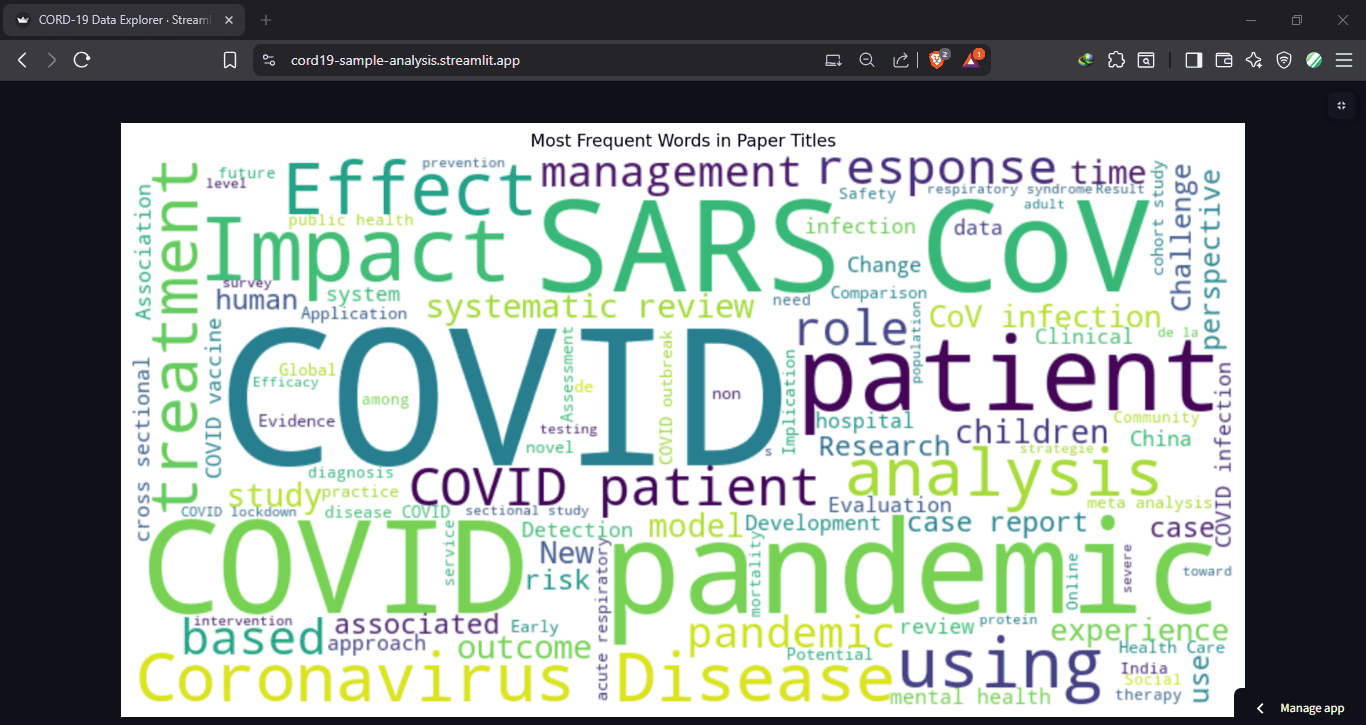
- Word Cloud of Titles: Most frequent words in paper titles to highlight research trends.
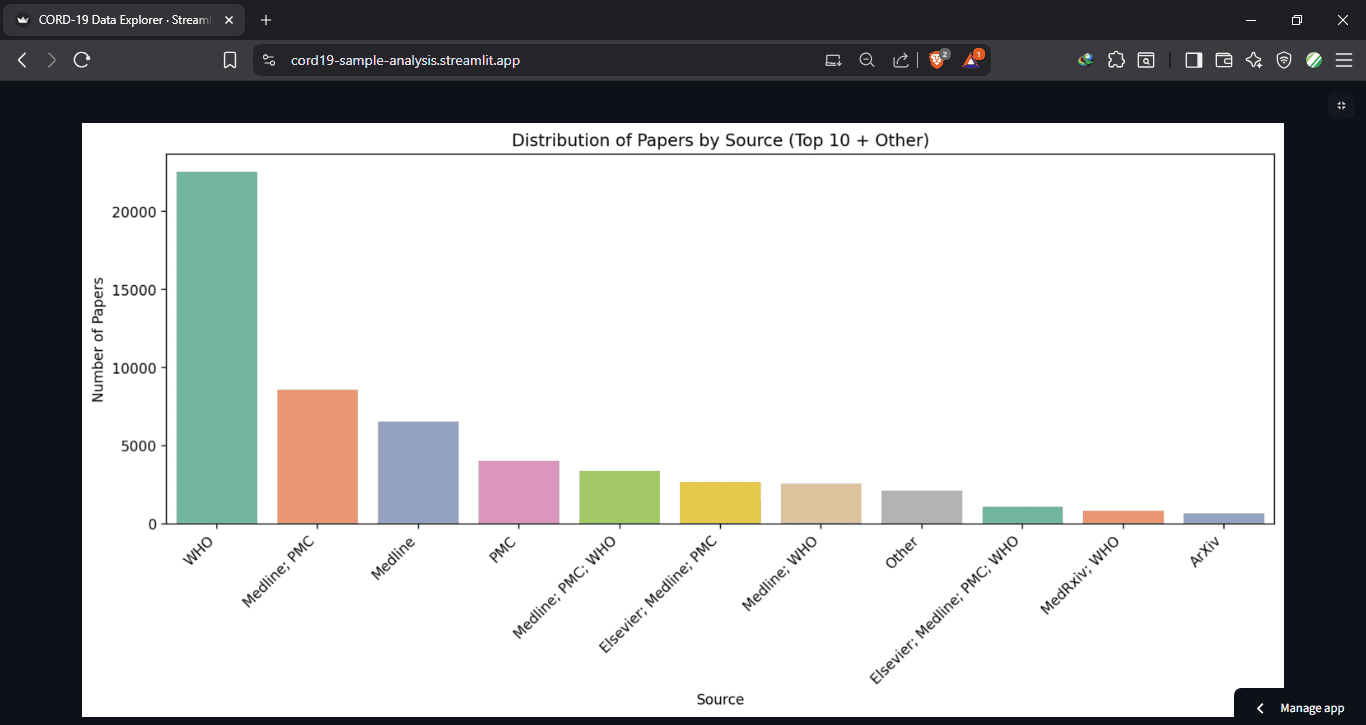
- Distribution by Source: Cleaned bar chart showing top sources of papers plus an 'Other' category.
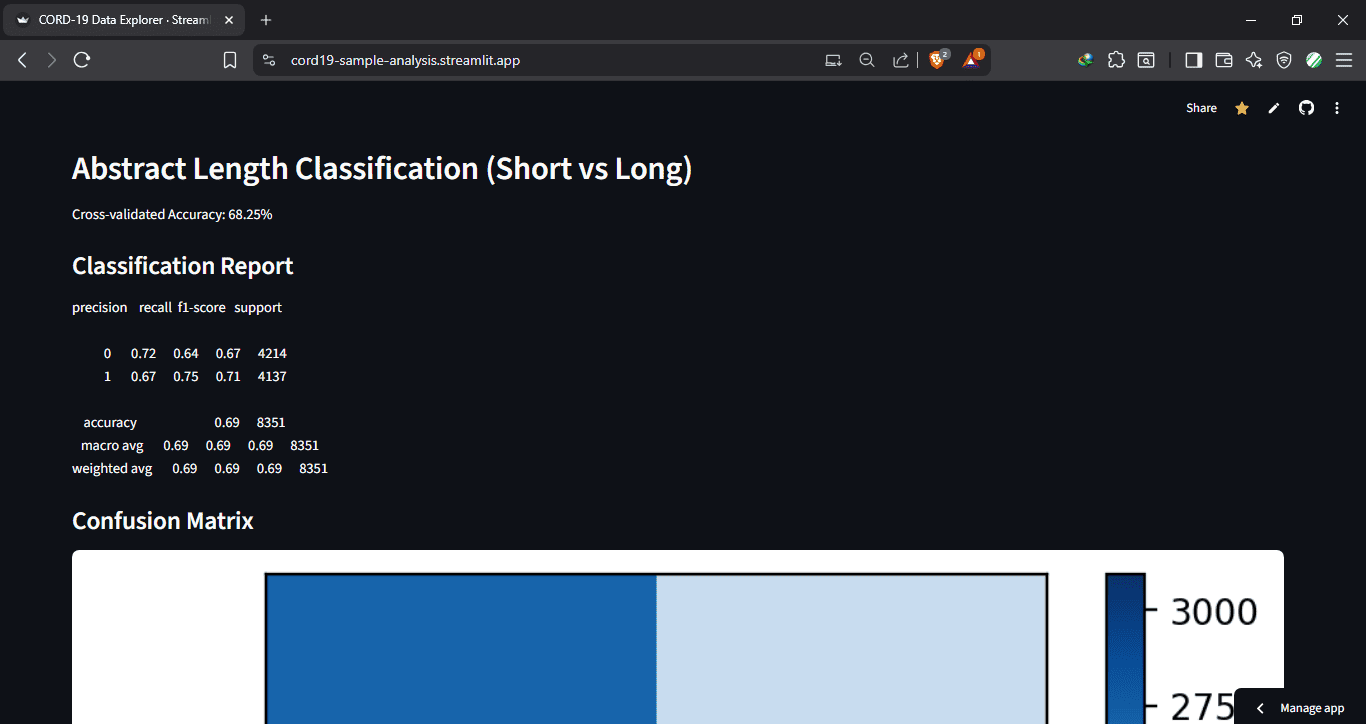
- Classify abstracts as short vs long based on word count using a Random Forest Classifier.
- Features include:
publish_yeartitle_word_countnum_authors- One-hot encoded top journals
- Outputs in the app:
- Cross-validated accuracy
- Classification report
- Confusion matrix
- Feature importance plot
- Predicted probabilities scatter and histogram
- Correlation heatmap of numeric features
- Built a fully interactive dashboard using Streamlit.
- Displayed tables, plots, and word clouds dynamically.
- Users can explore the dataset visually without running code locally.
- Clean, intuitive layout suitable for presentations or reports.
- Python Programming: Data loading, cleaning, and feature engineering.
- Data Analysis: Handling missing values, descriptive statistics, numerical and categorical processing.
- Data Visualization: Matplotlib, Seaborn, WordCloud for clear, interpretable plots.
- Machine Learning: Random Forest for classification, model evaluation (cross-validation, confusion matrix, feature importance).
- Web App Development: Streamlit dashboard for interactive exploration.
- Data Communication: Translating data insights into interactive visuals and concise reports.
- Source: CORD-19 Research Challenge - Kaggle
- File Used:
metadata.csv(or a sampled version for performance) - Contains:
- Paper titles and abstracts
- Publication dates
- Authors and journals
- Source information
Note: The full CORD-19 dataset is very large. This project uses a sampled dataset for fast exploration and deployment.
- Python 3.7+
- Libraries:
- pandas
- numpy
- matplotlib
- seaborn
- wordcloud
- scikit-learn
- streamlit
Install with:
pip install -r requirements.txt- Clone the repository:
git clone https://github.com/Robibiruk/CORD19_Sample.git
cd CORD19_Sample- Install dependencies:
pip install -r requirements.txt- Run the Streamlit app:
streamlit run main.py- Open the provided URL in your browser to interact with the app.
Experience the app live on Streamlit Cloud:
https://cord19-sample-analysis.streamlit.app/
- Data Exploration: Understand the dataset structure and identify cleaning needs.
- Cleaning & Feature Engineering: Handle missing values, create new columns, reduce categories.
- Visualization: Build plots to communicate patterns and trends.
- Machine Learning: Classify abstracts as short or long and analyze model performance.
- Streamlit App: Combine all analyses into an interactive dashboard for easy access and presentation.
- Hands-on experience with real-world scientific datasets.
- Skills in data cleaning, visualization, and basic ML classification.
- Experience building interactive data-driven web applications.
- Ability to communicate insights visually and interactively.
Robel Biruk
⚖️ This project is released under the MIT License.